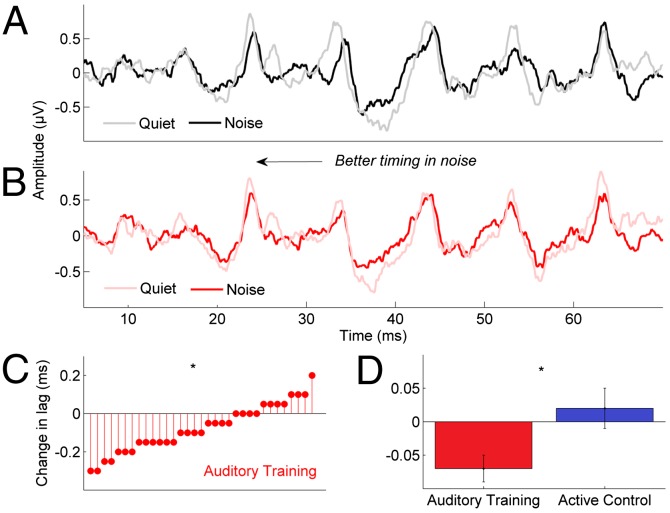
Fig. 5.
Quiet-to-noise timing shift differences. Responses in quiet and noise were cross-correlated to obtain an objective measure of timing (lag). (A) Before training, the expected noise-induced timing shift is observed, with the response in noise (black) lagging behind the response in quiet (gray) by 0.2–0.3 ms (shown in an individual participant). (B) After training, this individual’s response in noise (red) now overlays the response in quiet (pink) with minimal apparent lag. (C) Lag changes in each participant in the auditory training group, indicating a significant group change from pre- to posttest. (D) Mean group lag changes. *P < 0.01; error bars: ±1 SE.

