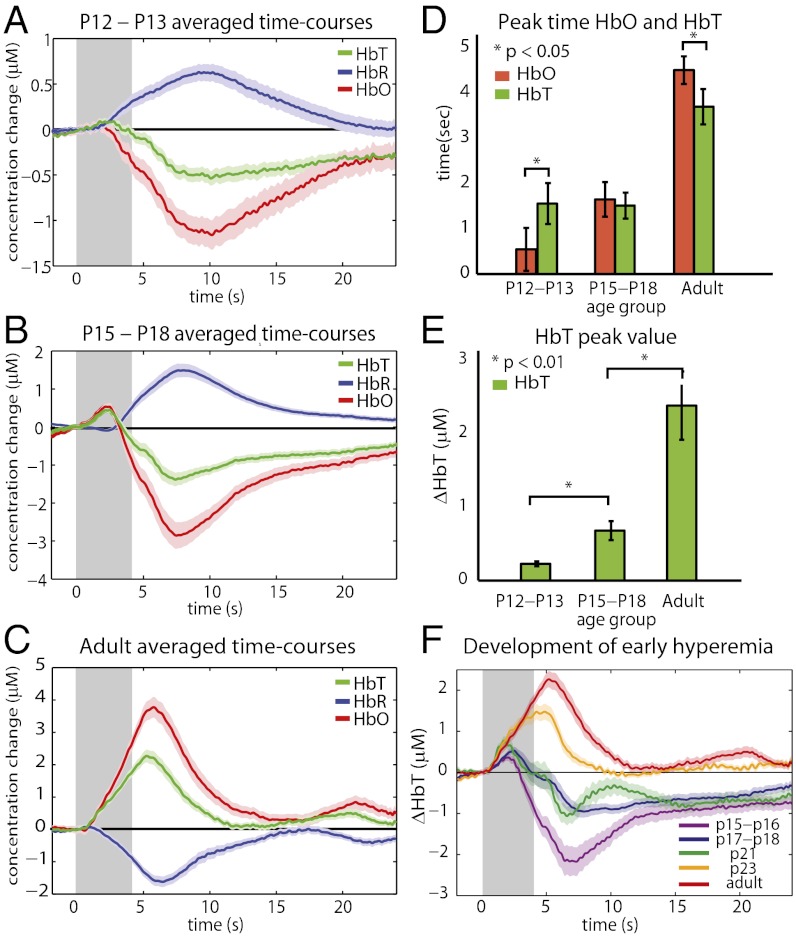
Fig. 2.
Progression from an inverted neonatal response to an adult response. Time-courses were generated by averaging HbO, HbR, and HbT traces from responding regions across rats in each age group (A) An inverted and prolonged response is observed in P12–P13 age group (n = 13 rats, runs = 72). (B) Intermediate age group of P15–P18 shows a small adult-like positive response, followed by a large undershoot (n = 9 rats, runs = 68). (C) Classic adult hemodynamic response in P80+ rats (n = 8 rats, runs = 67). (D) HbO peaks before HbT in younger animals (P < 0.05) and after HbT in older animals (P < 0.05). (E) The initial peak HbT response amplitude increases significantly with age (P < 0.01). (F) Averaged time-courses for five different age ranges (n = 4, 5, 2, 2, 9 rats and runs = 25, 43, 27, 22, 67, respectively). Note: A–C, and F show mean ± SEMs and time-courses averaged across all runs in each age group. Averages shown in D and E were calculated by first averaging all runs within an animal, and then using these single rat averages to calculate parameters and to generate age group averages and SEMs.

