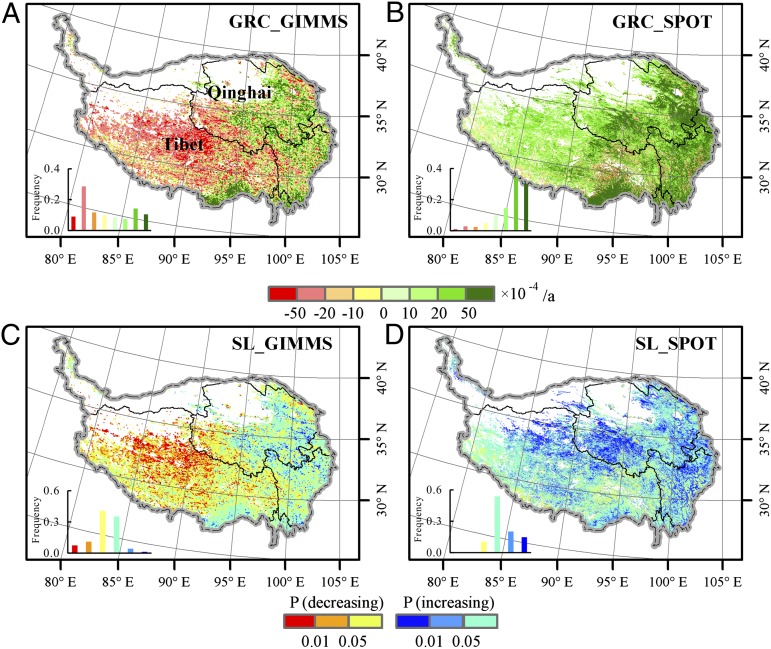
Fig. 3.
Spatial distributions of the greenness rate of change (GRC) (A and B) and significance levels (SL) (C and D) of the NDVI change in the Tibetan Plateau during the growing season from 1998 to 2006 based on the GIMMS and SPOT-VGT datasets. P(decreasing) and P(increasing) are the P values of the decrease and increase in the growing season NDVI, respectively, which are divided into three levels: P < 0.01, 0.01 < P < 0.05, and P > 0.05. The insets show the frequency distributions of corresponding trends (A and B) and different significance levels (C and D).

