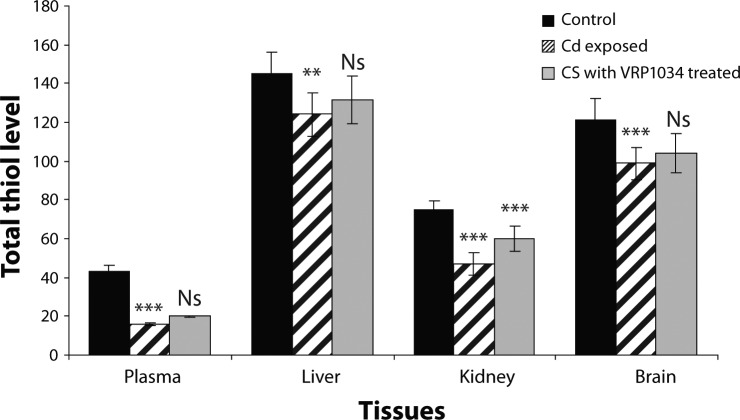
Figure 5.
Effect of ceftriaxone plus sulbactam with VR1M 034 on Total thiol level in cadmium exposed rat. All data are Mean ± SD of each group. The level expressed in plasma (µmol/ml) whereas in tissues (µmol/g tissue). Data are compared between control vs Cd exposed group and Cd exposed vs C+S with VRP1034 treated group. Where ***p<0.001 (highly significant); **p<0.01 (significant); *p<0.05 (significant) and Ns p>0.05.

