
Table Box 1.
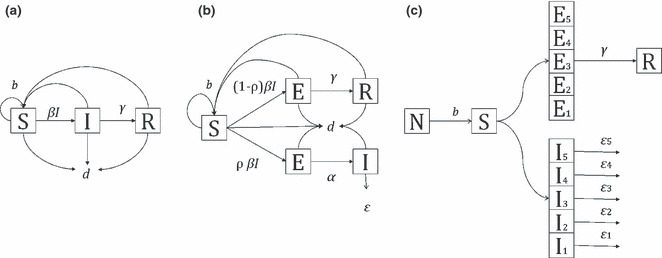
Classifying bat populations into susceptible (S), exposed (i.e. incubating infection; E), infectious (I) and recovered (immune; R) classes allows analysis of infection dynamics in bat populations. Three alternative model structures used to model the lyssavirus transmission period for different bat populations and their lyssaviruses are shown. Parameters are as follows: b‐birth rate; β‐transmission coefficient; γ‐rate of recovery (seroconverstion); ε‐disease‐induced mortality; d‐’natural’ mortality; ρ‐probability of infection causing disease
| (A) The SIR model structure used by Amengual et al. (2007) to understand possible asymptomatic European bat lyssavirus‐1 infection dynamics in Myotis myotis bats. |
| (B) The SEIR model structure used by George et al. (2011) to understand rabies virus (RABV) dynamics and persistence in Eptesicus fuscus. Three ‘seasons’ were modelled: spring birthing/pre‐transmission; summer transmission (with this structure) and winter hibernation (with no transmission). |
| (C) The SEIR structure used by Dimitrov et al. (2008) to understand how different immunotypes of host allowed RABV persistence in Tadarida brasiliensis bats and how RABV might select for different immunotypes in populations. N is population size (= S+E+I+R). Differing infectivity and mortality rates, d, were modelled, and infection and transmission or recovery was modelled with individual‐based models. |
|