
Figure 4.
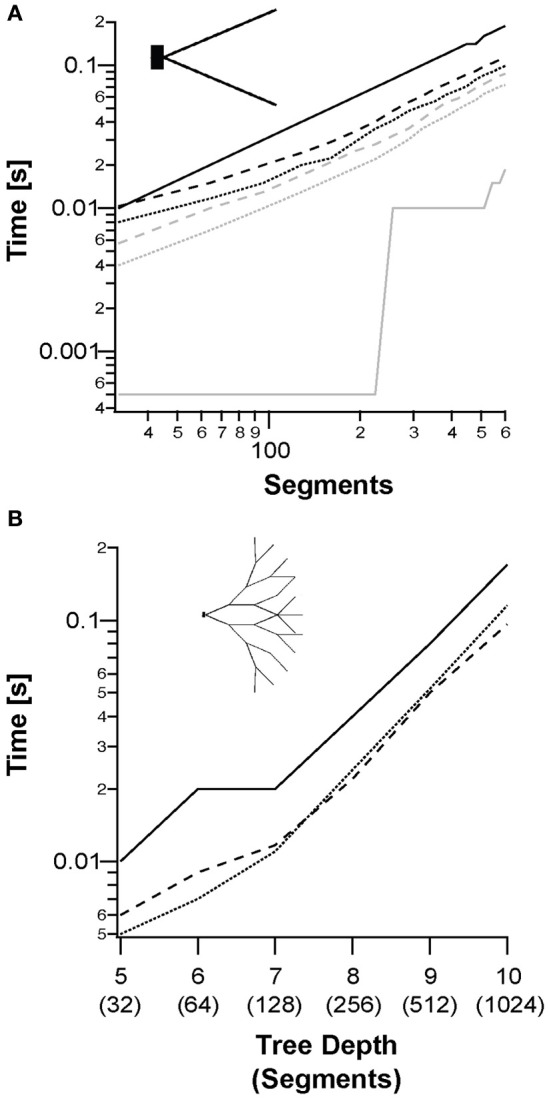
Simulation of a single sweep of a single neuron of different topologies, models, and scale. (A) Median runtimes of a fork morphology (inset) with increasing number of segments for: NEURON simulation (solid lines); segment-based parallelization (dotted line); and branching-based parallelization (dashed line). The Hodgkin–Huxley model is shown in black and the passive model in gray. (B) Median runtimes of full binary tree morphologies (inset) using the Hodgkin–Huxley model with increasing tree depth. The passive model is not shown for clarity.