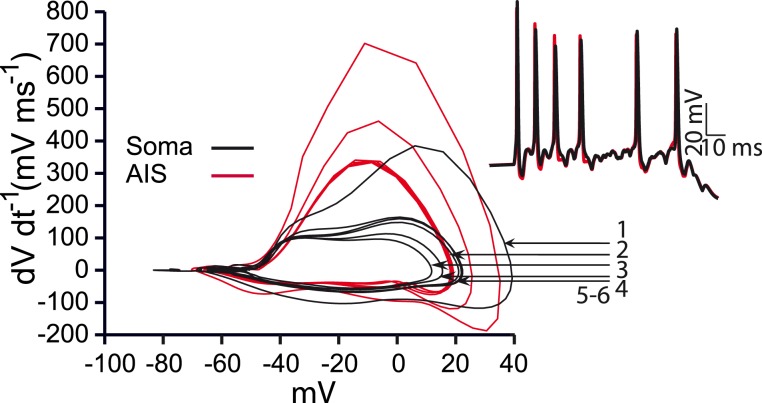
Figure A3.
Phase plots during bursting activity. Red curves represent activity recorded from the action initial segment and black curves represent activity recorded from the soma. The first three spikes have successively reduced amplitudes and the rate of voltage change drops indicating smaller total amounts of inflowing current. Arrows indicate the number of the somatic spike in the burst depicted in the inset.

