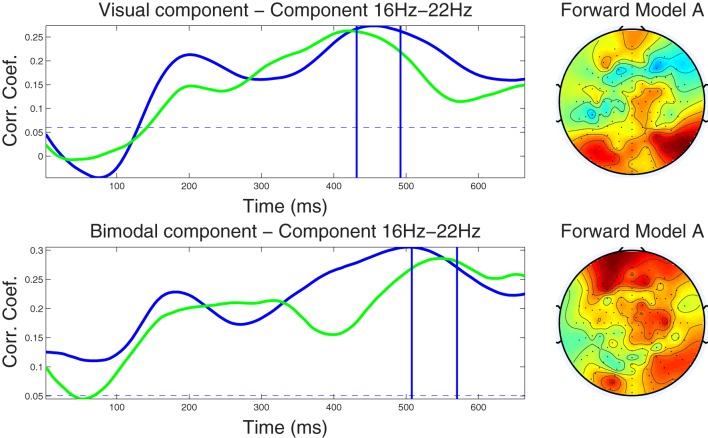
Figure 4.
Left column: Component correlation trace (CCT) on the beta-band (16–22 Hz) dataset for the visual (top) and audiovisual (bottom) conditions. The blue line shows the CCT from the training dataset, and the green line the CCT from the independent test dataset. The vertical blue lines identify the optimal window in which the correlated components were identified. The vertical axis shows the correlation coefficients between the extracted components and single-trial subject reaction times. Right column: Forward model derived from the beta-band dataset for the visual (top) and audiovisual (bottom) conditions. The hot to cold color scale indicates the average level of coupling between each correlated component and individual electrodes on the head surface.

