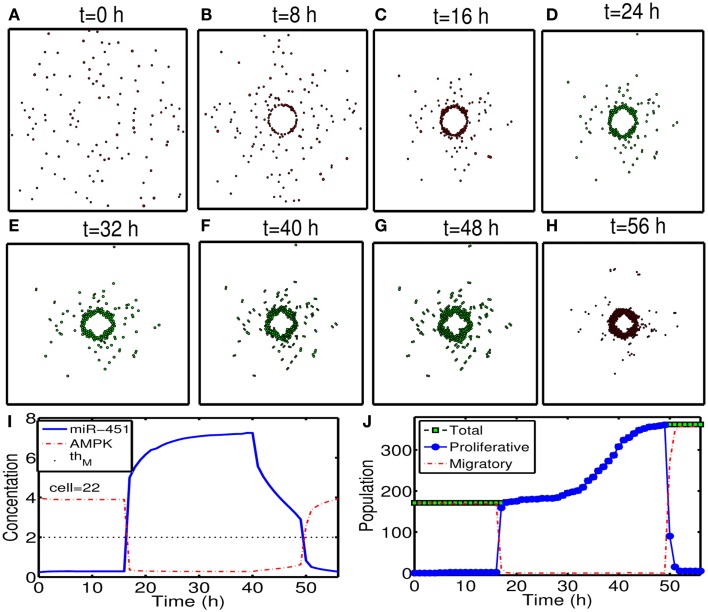
Figure 11.
(A–H) Tumor migration-proliferation patterns at t = 0, 8, 16, 24, 32, 40, 48, 56 h in response to injection of a chemoattractant at t = 0 h and glucose at t = 17 h after initial surgery at t = 0 h. Migratory cells switch to proliferative phenotype, forming a visible larger tumor mass, in response to glucose for second follow-up surgery. Migratory cells stop on the periphery of the resected area from the first surgery. It was assumed that a cell can sense the environment of the resection bed and the active force of a migratory cell is set to be zero when the cell reaches the periphery of the resection bed. Domain size = [0.2, 0.8] × [0.2, 0.8] ⊂ [0, 1]2. (I) Time course of miR-451 activity and AMPK level at a cell site (cell id = 22). Dotted black line in the middle = threshold value of miR-451 (thM = 2.0). (J) Time course of cell populations: proliferative (blue circle), migratory (red dotted), and total (green square) cells. All migratory cells switch to proliferative ones around t = 17 h when low miR-451 levels jump to higher value [M > 5 in (I)] and the level stays above threshold (thM = 2.0) due to glucose injection. Most of these proliferative cells enter the migratory phase (M < thM, A > thA) again around t = 49 h due to lowered glucose levels. Parameters used:

