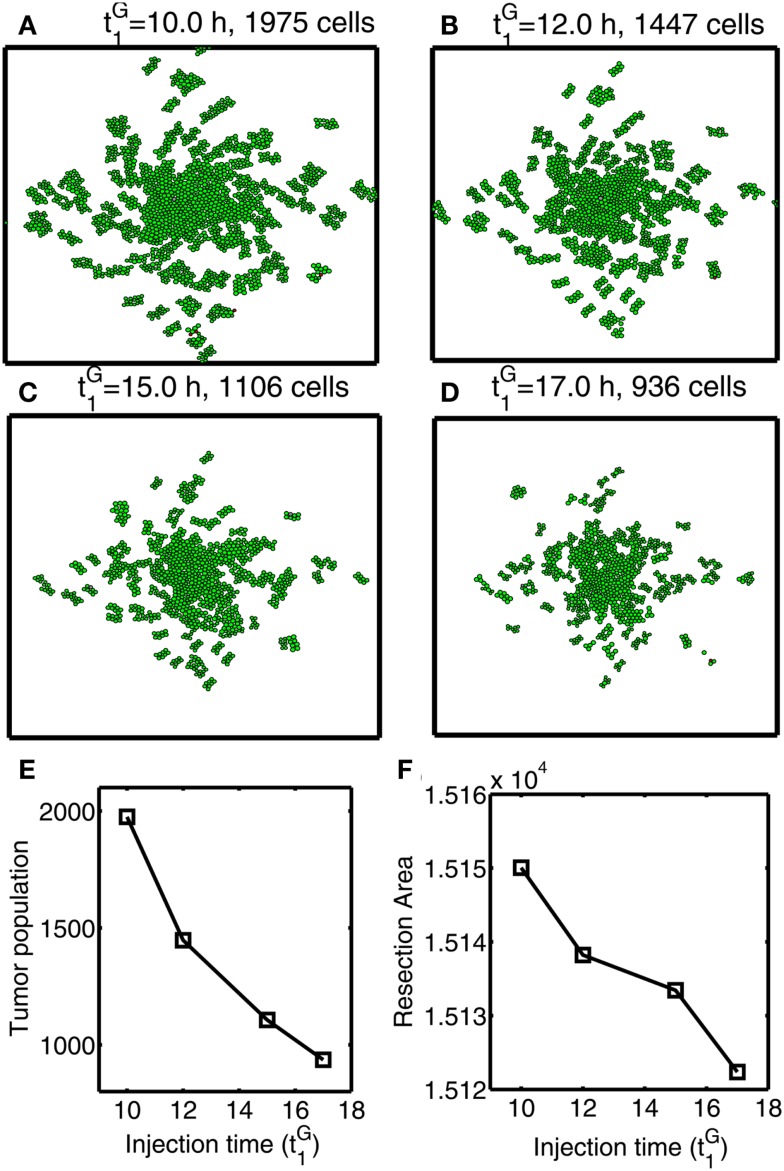
Figure 12.
Optimal strategy for glucose injection for second surgery after attracting invasive cells via chemotaxis. (A–D) Growth patterns at final time (t = 33 h) for various glucose injection time Domain size = [0.2, 0.8] × [0.2, 0.8] ⊂ [0, 1]2. (E) Tumor population for different Tumor population is decreased as is increased due to delay of growth signal. (F) Resection area for second surgery for various Resection area is decreased as injection time is increased.

