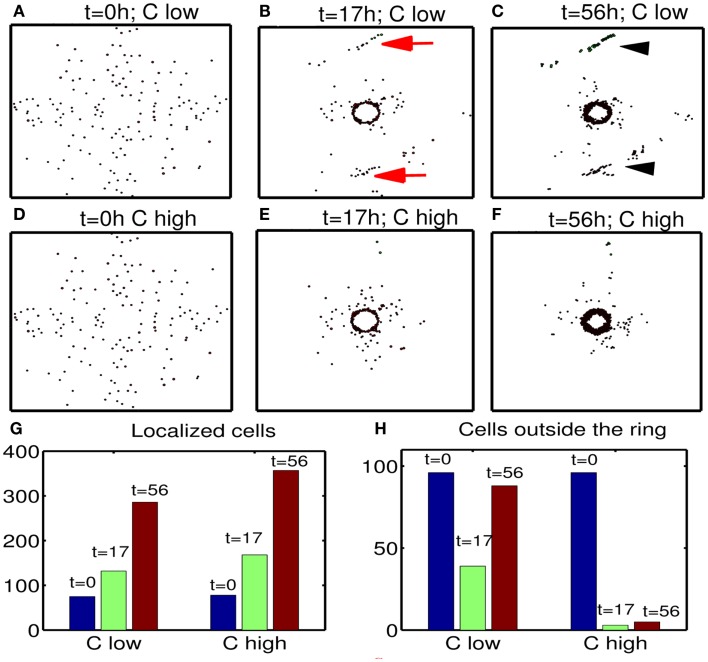
Figure 13.
Effect of chemoattractant strength () on efficacy of the therapy. (A–F) Tumor migration-proliferation patterns for low () and high (control) levels of a chemoattractant at t = 0, 17, 56 h. A high dose of glucose was injected at t = 17 h after initial surgery at t = 0 h. When the chemoattractant level is low, cells in the far away field do not effectively respond to the chemoattractant (red arrows in (B)), which induces further growth later at the undesirable location (black arrowheads in (C)). Domain size = [0.1, 0.9] × [0.1, 0.9] ⊂ [0, 1]2. (G) Populations of localized cells (cells with d < 0.25) for low (10-fold smaller) and high levels of chemoattractant. Here, is the distance from cell location (xi, yi) to the center (0.5, 0.5) of the domain. (H) Same as in (G) but for cells outside the localized domain (cells with d > 0.25). Parameters used:

