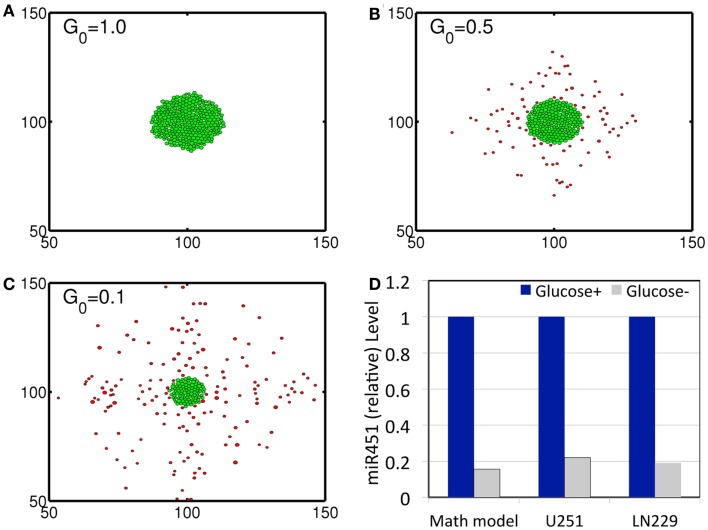
Figure 3.
(A–C) Profiles of tumor spheroid in response to high (G = 1.0), intermediate (G = 0.5), and low (G = 0.1) glucose levels at t = 30 h. Domain size = [50 μm, 150 μm] × [50 μm, 150 μm] = [0.25, 0.75]2 in the dimensionless domain [0, 1]2). (D) Comparison between simulation results and experimental data. In response to high (Glucose+, blue) and low (Glucose−, gray) glucose levels, miR-451 expression levels are quantified. Simulation results are in good agreement with experimental results on U251 and LN229 cell line in Godlewski et al. (2010a). *λb = 0, . It was assumed that tumor cells respond to the glucose gradient for migration in vitro as in Godlewski et al. (2010a).

