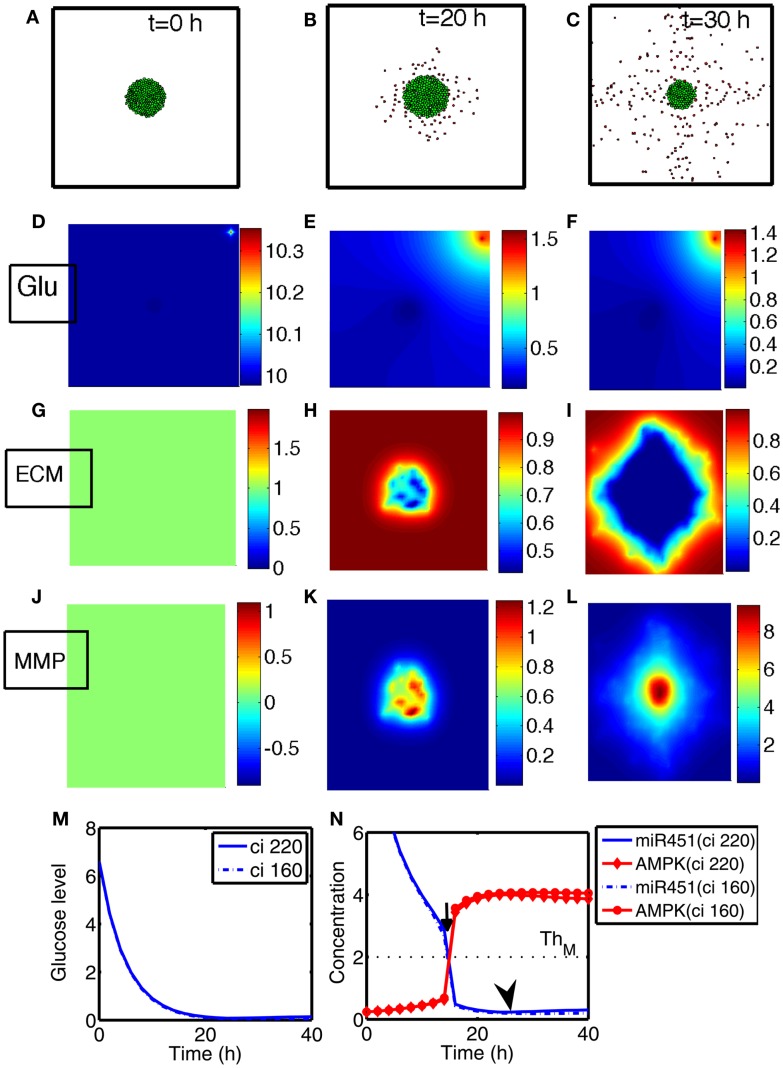
Figure 4.
(A–C) Tumor invasion pattern at time t = 0, 20, 30 h in response to glucose levels (G0 = 10). Domain size = [0.25, 0.75] ⊂ [0, 1]2. (D–F) Profiles of glucose concentration on the domain [0, 1] × [0, 1]. Glucose flux from a blood vessel induces a peak value at the upper right corner. (G–I) Profiles of ECM on the subdomain [0.25, 0.75] × [0.25, 0.75] ⊂ [0, 1]2. ECM were degraded in the invasive region. (J–L) Profiles of MMPs on the subdomain [0.25, 0.75] × [0.25, 0.75] ⊂ [0, 1]2. MMPs are localized in tumor region. (M) Glucose levels at two cell sites (cell id = 220, 160). (N) Concentrations of intracellular variables, miR-451 and AMPK complex, at the cell sites in (M).

