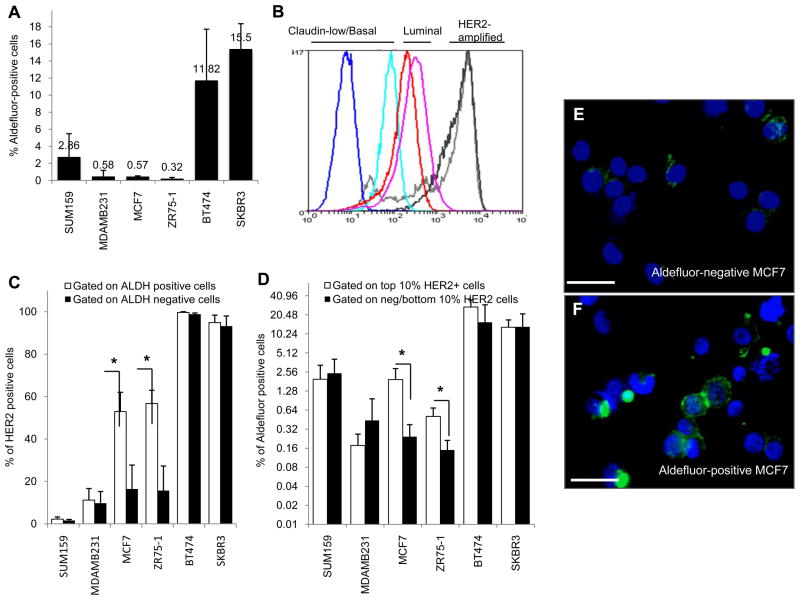
Figure 1.
High HER2 protein expression correlates with increased levels of ALDH activity in luminal breast cancer cell lines. A, The percentages of ALDH positivity as assessed by the Aldefluor assay in basal/claudin-low (SUM159, MDA-MB231), luminal (MCF7, ZR75-1) and HER2-amplified (BT474, SKBR3) cells. B, HER2 expression by FACS of the same cell lines demonstrated low HER2 expression (basal/claudin-low (dark and light blue)), moderate HER2 protein (luminal (red and pink)) and high levels of HER2 expression (amplified (light and dark grey)). C, FACS analysis of Aldefluor positive and negative cells demonstrated enrichment for HER2 expression in Aldefluor positive cells. D, FACS analysis of the top 10% of HER2-positive and bottom 10% HER2-negative cells demonstrated enrichment for Aldefluor positivity within HER2-positive cells. Increased HER2 expression correlated with increased Aldefluor activity where * is denoted, p<0.05. E–F, Immunofluorescence demonstrating increased HER2 expression in Aldefluor-positive compared to Aldefluor-negative MCF7 cells. Scale bar 50μm.

