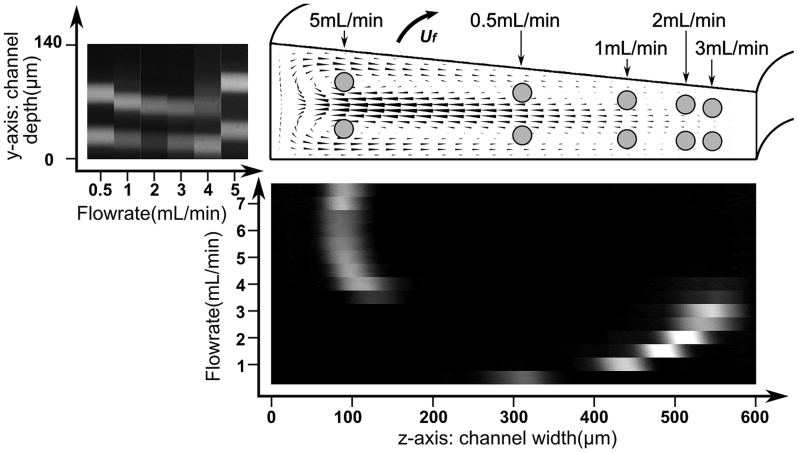
Figure 2. Balance of particles in a trapezoidal cross-section spiral microchannel with 80/140 μm inner/outer depth and 600 μm width.
The black cones within channel cross-section are CFD simulation result of the Dean flow velocity (also Dean drag force) at a flow rate of 3.5 mL/min in a channel with radius 7.5 mm. The experimental images of 26.25 μm fluorescent beads distribution from the top view and side view are placed at the bottom and the left side of the simulation. By combining the top and side view observations, the positions of 26.25 μm beads at typical flow rate are drawn in gray circles in the channel cross-section.

