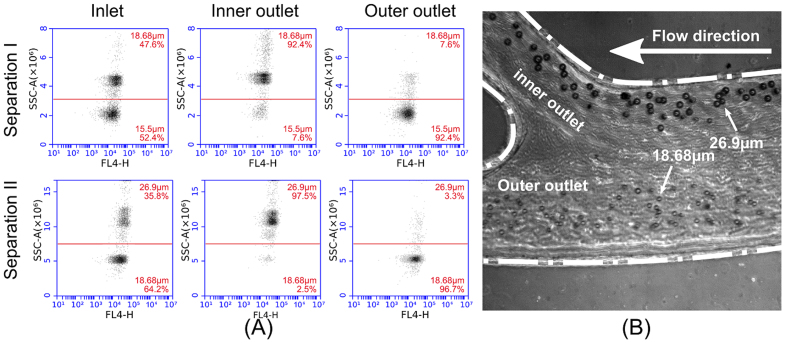
Figure 5.
(A) Scatter plots captured using flow cytometer (Accuri C6, BD Biosciences, USA) showing the results of separations of particle mixtures in a trapezoidal cross-section channel (80/130 µm inner/outer depth, 600 µm width).(B) High speed microscopy image (Phantom V9.1, Vision Research Inc. USA, exposure time = 4 μs) captured at the outlet bifurcation clearly showing the separation of 18.68 μm and 26.9 μm particles at a flow rate of 3.4 mL/min (refer supplementary information for the video).

