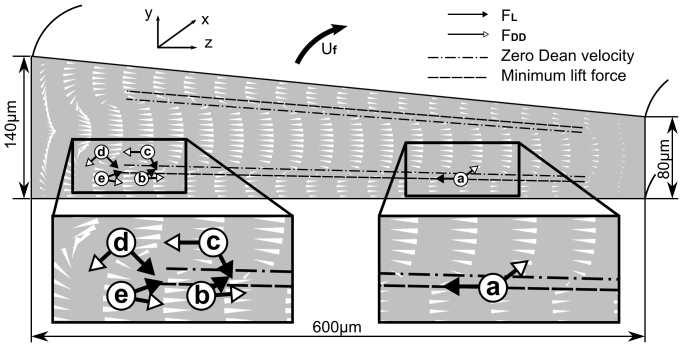
Figure 7. Schematic illustration of the forces acting on the particles at several typical positions in a trapezoidal cross-section microchannel.
Forces acting on particles at positions (a) indicate the imbalance at inner side at high flow rate. Forces acting on particles at positions (b), (c), (d) and (e) illustrate that these particles tend to be trapped near the Dean vortices center at different points. White cones indicate the direction and logarithmic magnitude of simulated Dean velocity as well as Dean drag.

