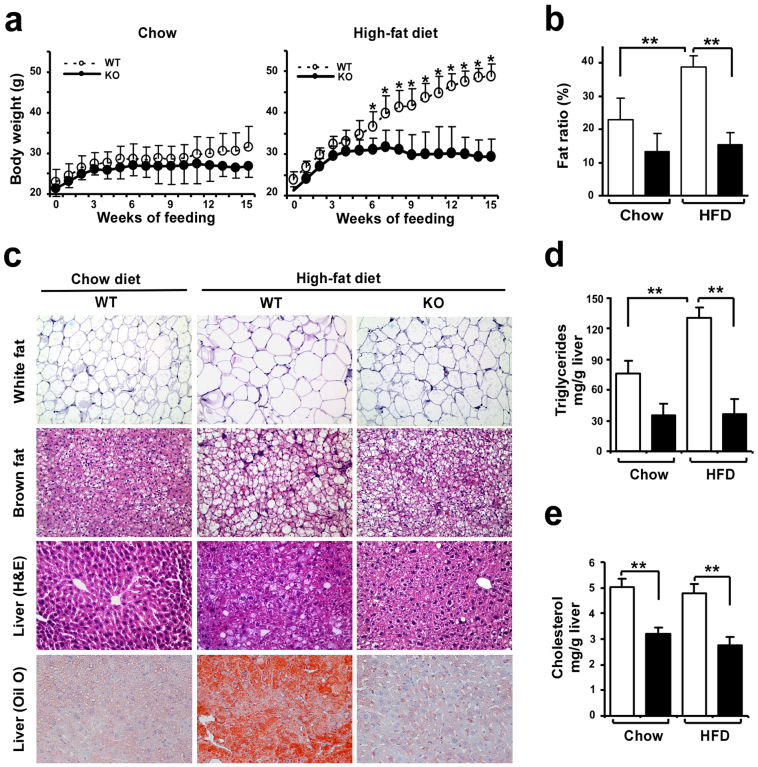
Figure 2. Resistance of Egr-1 null mice to diet-induced obesity.
(a) Growth curves of wild-type and Egr-1−/− mice (n = 3–6) fed chow or high-fat diet for 15 weeks. (b) Body fat mass was evaluated by NMR scanning (n = 3–6) and the ratio of fat mass to body weight was shown. (c) White fat and brown fat pads were collected, fixed, and subjected to hematoxylin and eosin (H&E) staining (n = 2/group). A representative image is shown (10× magnification); Livers were collected, fixed, and subjected to Oil Red O staining (10× magnification). (d&e) Hepatic triglycerides (d) and Cholesterol (e) were measured (n = 3–6). All data are expressed as the mean ± SD; *P < 0.05; **P < 0.01.

