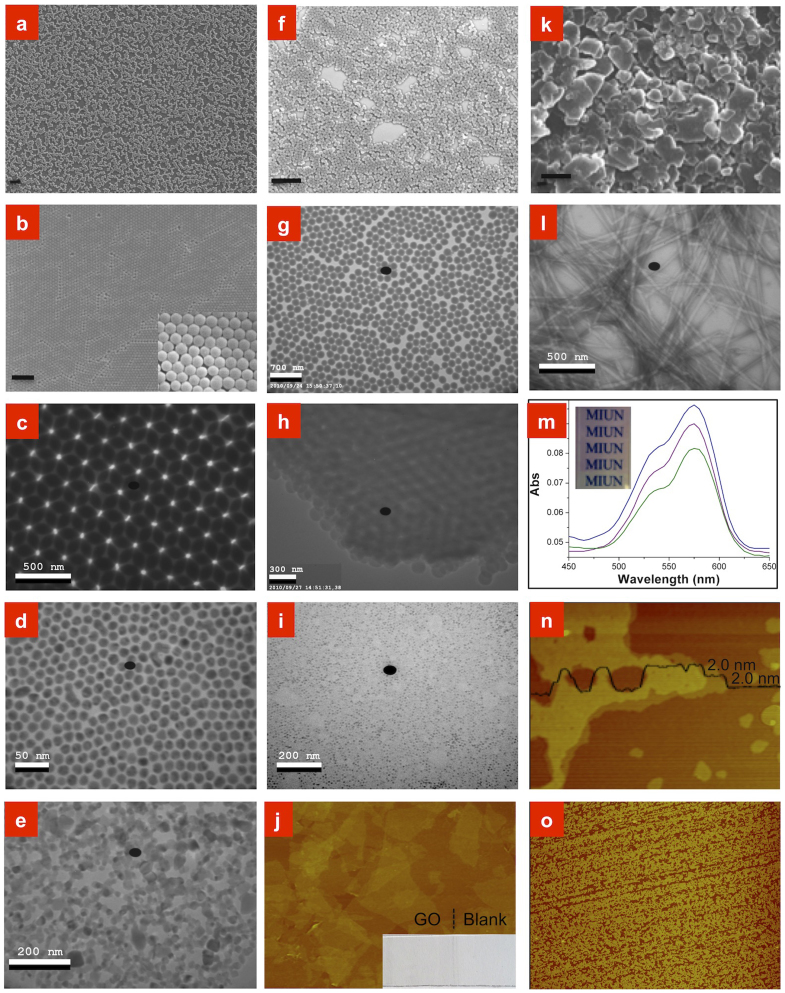
Figure 2. Soap-film coating of nanoparticles, layered materials, nanowires, and molecules.
(a-e) Inorganic nanoparticles. (a–c) SFC-coated silica films with silica weight concentrations of 1.0 wt%, 2.1 wt% and 2.9 wt%. (a) scanning electron microscope (SEM) image of a 240-nm sub-monolayer of silica nanoparticles (scale bar is 2 μm). (b) SEM image of a 240 nm monolayer of silica nanoparticles (scale bar is 2 μm, and the inset shows an image at higher magnification). (c) Transmission electron microscope (TEM) image of a double-layer of silica nanoparticles. (The black dot in all the TEM images is an imaging artefact.) (d) TEM image of a monolayer of gold nanoparticles. (e) TEM image of a single-layer of TiO2 nanoparticles. (f–j) Organic and bio-organic nanoparticles. (f–h) SFC-coated polystyrene nanoparticles. See SEM images of triple- and multi-layers in Supplementary Fig. S10. (f) Sub-monolayer of polystyrene (scale bar is 2 μm). (g) Monolayer of polystyrene. (h) Triple-layer of polystyrene. (i) TEM image of a monolayer of ferritin. See higher magnification images in Supplementary Information. (j–o) Coated layered materials, nanowires, and molecules. (j) Atomic force microscope (AFM) image of a <1.5-layer GO film (3 μm × 2 μm). The inset shows an image of the coated layer after it was annealed at 240°C for 2 min. See transmittance measurements of this GO film in Supplementary Fig. S1. (k) SEM image of clay on glass (scale bar is 2 μm). (l) SFC-coated nanocellulose, also see the image in Supplementary Fig. S5. (m) Absorbance spectra of 1~3 times coated and an image of Rhodamine B on a glass slide. (n) and (o) Small-scale (2 μm × 1.5 μm) and large-scale (20 μm × 15 μm) AFM images of a SDS sub-double layer.

