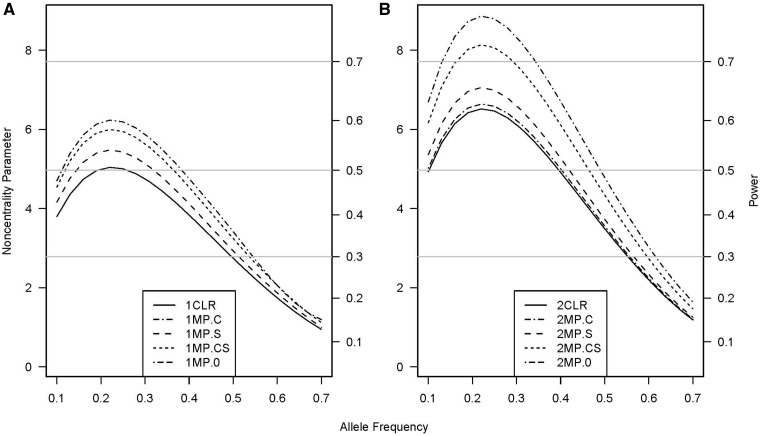
Figure 2.
Non-centrality parameter and power for tests of multiplicative genetic-by-exposure interaction effects as a function of allele frequency. All designs used 300 sibships with one (panel A) or two control siblings (panel B); some designs included supplemental unmatched subjects. The risk parameters are: R1 = 1, R2 = 2, RE = 1.5, I2 = 2, and I2 = 2. Exposure prevalence was 0.3. Vertical axes: left, the chi-squared non-centrality parameter for a 2-df likelihood-ratio test; right, power at α = 0.05 (horizontal lines mark selected power levels). The 1 and 2 before the abbreviations represent 1 and 2 control siblings per case, respectively. Curves: solid (CLR), with or without supplemental subjects analyzed with conditional logistic regression (CLR does not use unmatched subjects and the power is therefore the same for scenarios with or without supplemental subjects); dash-dot (MP.C), 150 supplemental cases analyzed with the missing-parents approach; long-dash (MP.S), 150 supplemental sets of controls analyzed with the missing-parents approach; short-dash (MP.CS), 75 supplemental cases and 75 supplemental sets of controls analyzed with the missing-parents approach; and dash-dash-dot (MP.0), no supplemental subjects analyzed with the missing-parents approach (concealed under the solid curve in panel A)

