Figure 3.
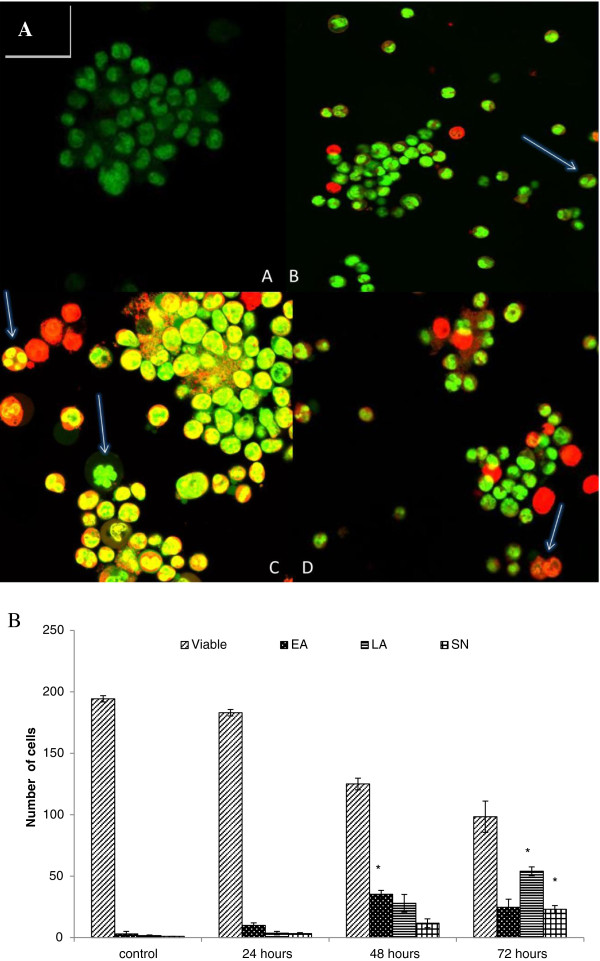
Confocal micrograph of acridine orange and propidium iodide double-stained CEMss cells. Cells were treated at IC50 of Boesenbergin A at time-dependent manner. (A) Untreated cells showed normal structure without prominent apoptosis and necrosis. (B) Early apoptosis features were seen after 24 h representing intercalated acridine orange (bright green) amongst the fragmented DNA (arrows). (C) Blebbing and nuclear margination were noticeable after 48 h treatment (arrows). (D) Late apoptosis was seen after 72 h post-treatment whereby a positive staining of orange color represents hallmark of late apoptosis (arrows). Figure 3B Histogram representing qualitative analysis of confocal micrograph consisting of acridine orange and propidium iodide double-stained treated and untreated CEMss cells. CEMss cell death via apoptosis increased significantly (p < 0.05) in a time-dependent manner. However, no significant (p > 0.05) difference was observed in the cell count of necrosis. (EA: early apoptosis; LA: late apoptosis; SN: secondary necrosis). ‘*’ indicates significant differences from the control (p < 0.05).

