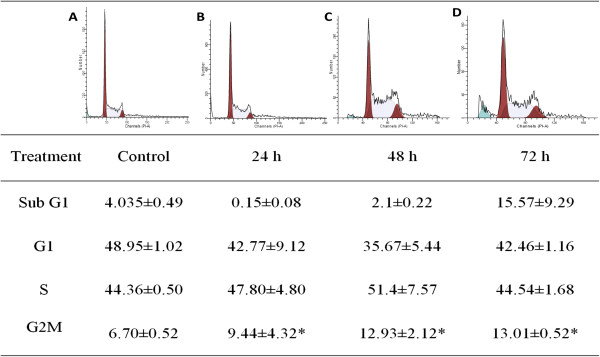
Figure 4.
Flow cytometric analysis of cell cycle distribution in CEMss cells treated with Boesenbergin A at 8 μg/ml for A) Untreated, B) 24, C) 48, and D) 72 h. Data were shown as Mean ± SEM. *p<0.05 vs. 0 h (Control). Cells were cultured in RPMI 1640 (25 ml flask) media maintained at 37°C and 5% CO2.

