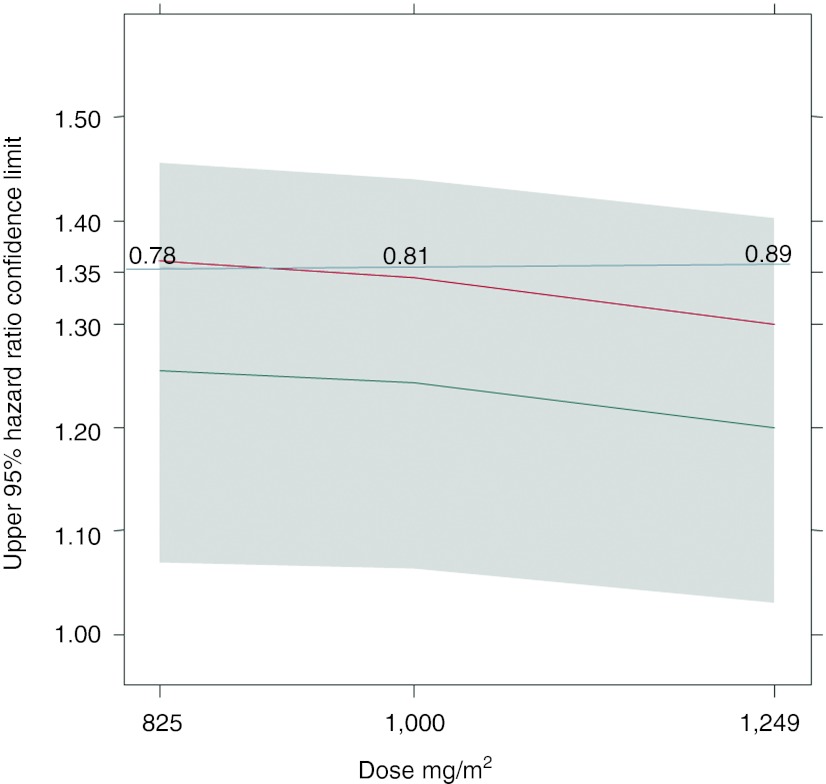
Figure 1.
Upper limits of 95% hazard ratio CI for simulated studies comparing various capecitabine doses to 1,250 mg/m2 for a 470 event design. Gray area: 90% prediction interval across 2,000 replicates; Gray line at 1.35: threshold to achieve noninferiority (>80% power); Black line: median; Red line: 80% power line; Numbers: actual power of a study with a specific dose.

