Figure 5.
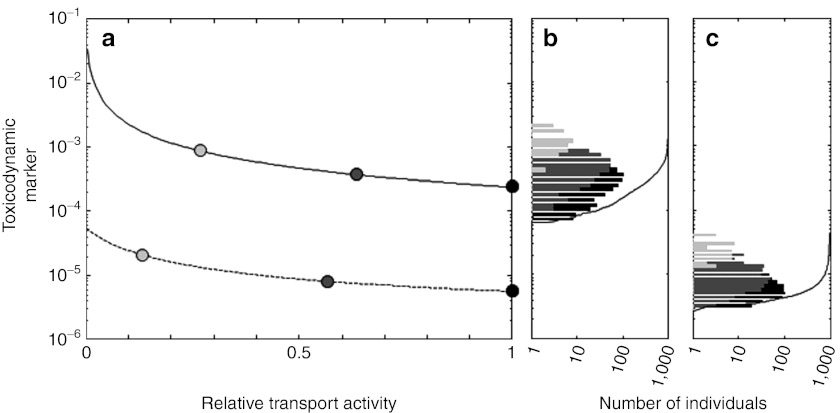
A toxicodynamic (TD) marker for statin toxicity. (a) The TD marker for pravastatin (dashed line) and simvastatin acid (solid line) is plotted as a function of transporter activity relative to the mean transport activity of the TT genotype. Mean activities for all genotypes are indicated by circles (TT: black, TC: dark gray, CC: light gray) and the extrapolated intermediate values are indicated by a solid line. (b,c) Genotype-specific distributions of the TD marker in population PK studies (TT: black bar, TC: dark gray bar, CC: light gray bar) for 1,000 virtual patients (cumulated distribution, black line) on treatment with (b) simvastatin acid and (c) pravastatin. The distributions are based on the population PK plots in Figure 4.

