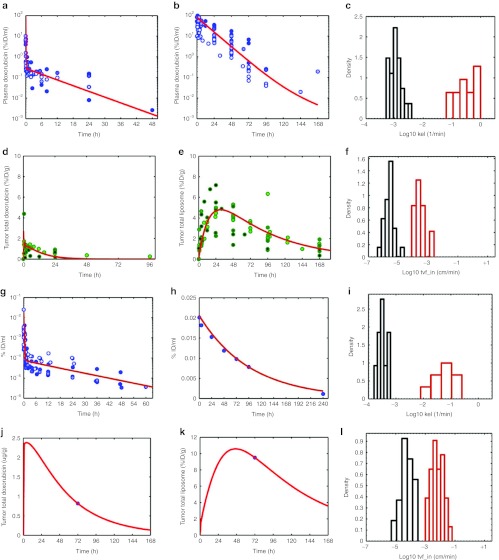
Figure 3.
Model training with literature data. (a,b) Doxorubicin and pharmacokinetic (PK) and tumor deposition data in mice were gathered from the literature (Supplementary References online), normalized to percent injected dose per ml and is shown in panels a and b (circles). Doxorubicin doses ranged from 0.5 to 20 mg/kg. In all studies, doxorubicin was quantified via high-performance liquid chromatography (HPLC). Tumor models included HepG2, Li-7, BT-474, 4T1, and NCI-N87. Similarly, tumor deposition data for conventional doxorubicin and pegylated liposomal doxorubicin (PLD) were extracted from the literature, normalized to percent injected dose/g of tumor tissue is shown in d and e (circles). Liposome data were restricted to pegylated liposomes, ~100 nm in diameter and containing doxorubicin. Liposome doses ranged from 3 to 20 mg/kg (equivalent doxorubicin dose). Xenograft models included BT-474, NCI-N87, KB, A375, B16F10, HepG2, Li-7, 4T1, and M190-FR (data not shown). Multiple detection methods were used for tracking liposomes: encapsulated doxorubicin (measured by HPLC) or radiolabeled lipids (3H, 67Ga, 111In, or 125I). The kinetic model from Figure 1 was fit to each set of data in panels a,b, d, and e (solid lines), as described in Methods section. Individual parameter estimates for doxorubicin (red) and PLD (blue) elimination from the central compartment (kel_dox and kel_lipo, respectively) are shown as a histogram in c. Individual parameter estimates for conventional doxorubicin (dashed lines) and PLD (solid lines) transvascular flux (tvf_in_dox and tvf_in_lipo respectively) from capillary to interstitial space in the tumor are shown as a histogram in f. (g) Human plasma PK data were compiled from the literature and as normalized to percent injected dose/ml (circles). Doxorubicin PK parameters (k12_dox, k21_dox, kel_dox) were fit to the data with the mean fit to the data shown in red. (h) Representative PLD plasma PK data from Harrington et al.8 is shown with the corresponding model fit, estimating kel_lipo, shown in red. A single data set is shown for clarity, due to the varying need for one vs. two-compartment models to describe human liposome PK. (i) The variability in estimated elimination rates for doxorubicin and PLD (kel_dox and kel_lipo), is shown. (j) A representative fit of the human model, fitting tvf_out_dox, to conventional doxorubicin tumor deposition data for 10 mg/m2 doxorubicin is shown from a patient with Kaposi sarcoma from the study of Northfelt et al.21 (k) A representative fit of the human model (fitting tvf_in_lipo) to PLD tumor deposition data is shown for a patient with breast cancer from the study of Harrington et al.8 treated with 111In-labeled PLD. (j,k) Representative fits for clarity of presentation, the PLD tumor deposition data are also shown in Supplementary Figure S1b online. (l) A summary of the variability of doxorubicin and PLD deposition parameters (tvf_in_dox and tvf_in_lipo) for human patients is shown. tvf_in_dox values were estimated from dynamic contrast enhanced-magnetic resonance imaging data in human tumors, as described in Results section. tvf_in_lipo values were estimated from patients with various tumor types from the study of Harrington et al. and Northfelt et al.8,21

