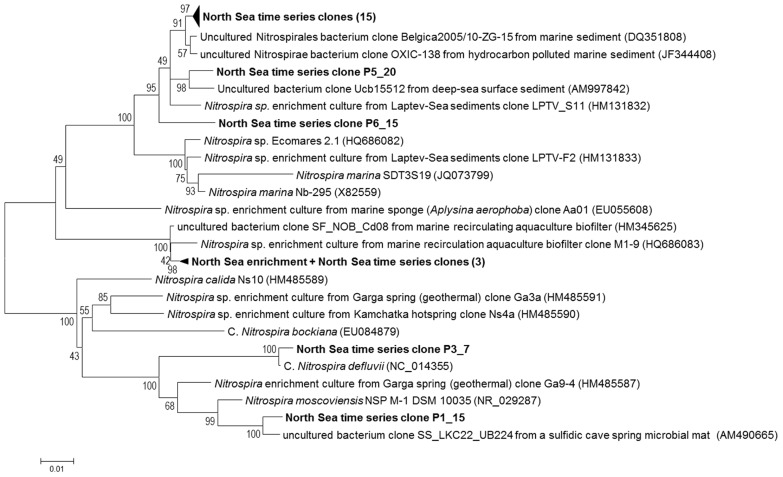
FIGURE 3.
Phylogenetic tree showing the positions of the enriched North Sea NOB and North Sea time series clone sequences (bold) in relation to known Nitrospira sequences and related sequences from the NCBI database. This unrooted bootstrap (1000 replicates) consensus tree was inferred using the neighbor-joining algorithm. Total of 1013 nucleotides were considered in the alignment. Bootstrap values are shown at the internal nodes. The scale bar is in the unit of the number of base substitutions per site. For the North Sea time series clones the first number after the P indicates the pool (see Table 2) the clone was derived from. The second number identifies from which clone within the pool the sequence was derived. The 15 clone sequences within the upper collapsed branch are: P1_12, P1_27, P2_3, P2_17, P2_27, P2_46, P3_30, P4_33, P5_1, P5_3, P5_5, P6_8, P6_11, P6_12, and P6_14. The three North Sea time series clone sequences within the collapsed branch with the North Sea NOB enrichment sequence are: P3_4, P3_5, and P4_29.

