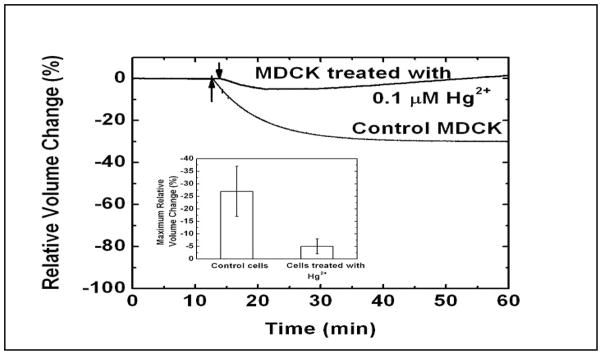
Fig. 3.

Volume response of cells to shear stress after mercurial treatment. The MDCK cells were treated with 0.1 μM HgCl2 for 1 min followed by rinsing with isotonic solution. The volume change of the cells under shear stress was measured using the volume sensor. The arrows indicate the change of shear stress from 0.2 to 2.0 dyn/cm2. The graph insert shows the maximum relative volume change of control cells (n=3) and cells treated with HgCl2 (n=4). The error bar indicates the standard deviation. The cells treated with Hg2+ showed less cell volume reduction than the control cells suggesting that AQPs were involved.
