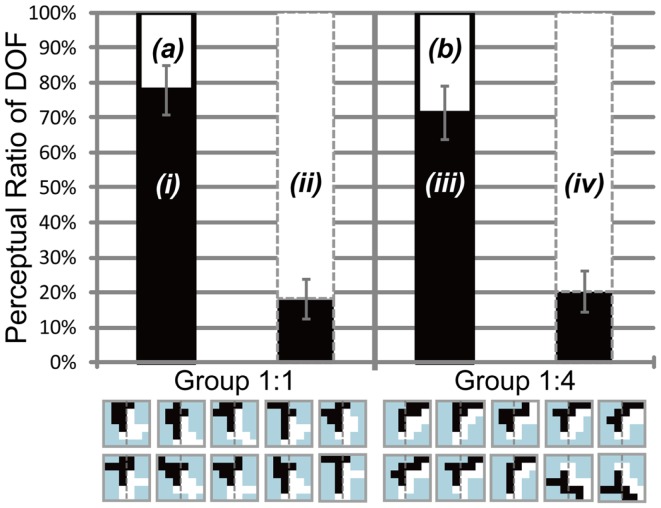
Figure 8.
Results of Experiment 3, which was performed using the same conventions as those shown in Figure 4. The two bars in the left panel indicate the results obtained using balanced motion direction difference (Group 1:1) as a control. The two bars in the right panel indicate the results obtained using unbalanced (Group 1:4) motion direction difference, with a higher amount of motion direction difference in the right half of stimuli (the side of the white object) than in the alternative half (the side of the black object). Gray dashed lines on the stimulus icons mean the center of the each of them. Participants perceived figure more frequently in the direction with a higher amount of motion direction differences when attending the region with a lower amount of motion direction difference [white in the left bar surrounded by black solid contour of Group 1:4 (b) is higher than that of Group 1:1 (a)]. No such difference was observed when attending the region with a higher amount of motion direction difference [white in the bar surrounded by gray dashed contour shown by (ii) and (iv)]. See text for details.

