
Figure 2.
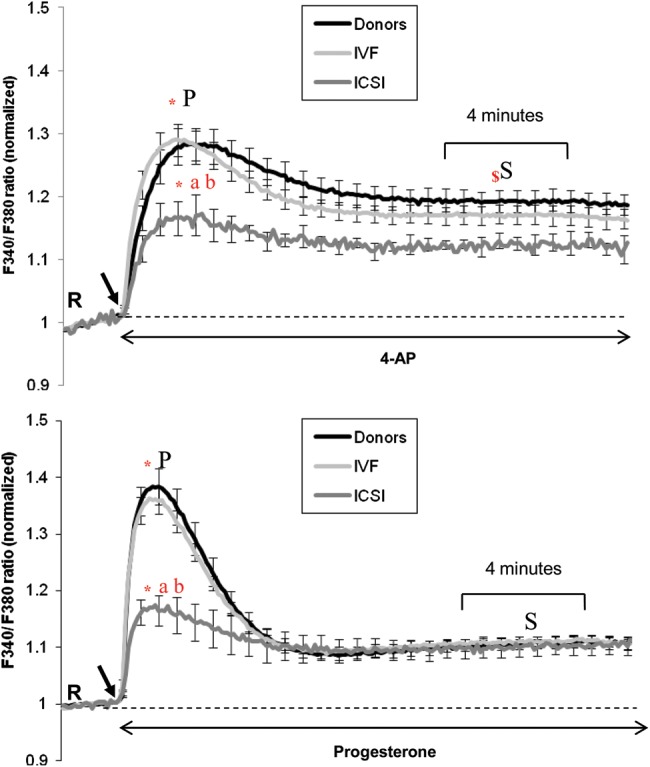
Ca2+ ratio in response to 4-AP and progesterone in three populations (donors, IVF and ICSI patients). Intracellular Ca2+ responses induced by 4-AP (upper panel) and progesterone (lower panel) in donors (4-AP n = 36, progesterone n = 37), IVF (4-AP n = 61, progesterone n = 68) and ICSI patients (4-AP n = 7, progesterone n = 11). Each trace shows mean of n fluorimetric (population) responses ± SE. Agonists were added (indicated by black arrow) at 100 s after acquisition of 20 readings at resting level (R). The data for each sample were normalized to pre-stimulus (R) level to facilitate comparison. *Significant difference between the ratio at the peak (P) and the initial resting level (R), (a) significant difference of ratio at peak between donor and ICSI patients, (b) significant difference of ratio at peak between IVF and ICSI patients. $Significant difference between the ratio at the sustained phase (S) between donor and ICSI patients (P < 0.001) and between IVF and ICSI patients (P = 0.007). There was no significant difference in the sustained response with progesterone between the groups. Significance was considered as P < 0.05 assessed non-parametric ANOVA on ranks Kruskal–Wallis test.