
Figure 3.
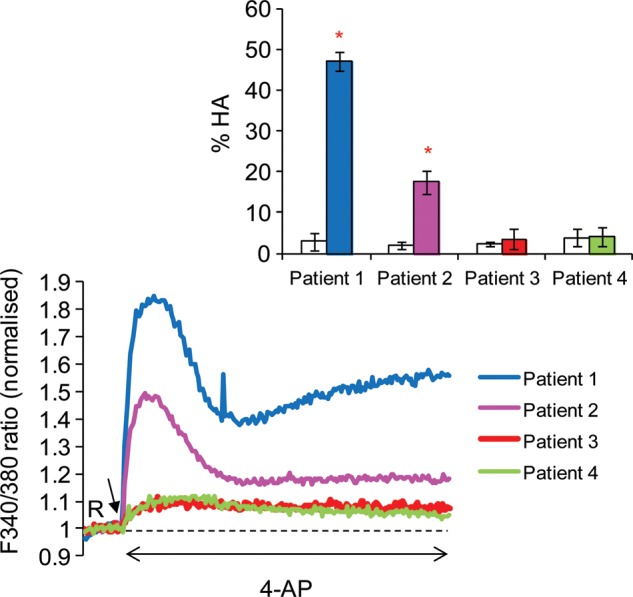
Intracellular Ca2+ in response to 4-AP from four IVF patients including two with a failed Ca2+ response. Inset shows % HA from the same patients labelled with the same colours; white bars show % HA in the baseline (control) and coloured bars show % HA in samples treated with 4-AP. Patients 3 and 4 showed a failed intracellular Ca2+ and HA responses to 4-AP (IVF fertilization rates for patients 3 and 4–39% and 6% respectively). 4-AP was added to suspensions at 100 s after acquisition of 20 readings at resting level (R) indicated by black arrow. The HA data (inset) are the mean ± SD. *Values are significantly different to baseline (P < 0.05).