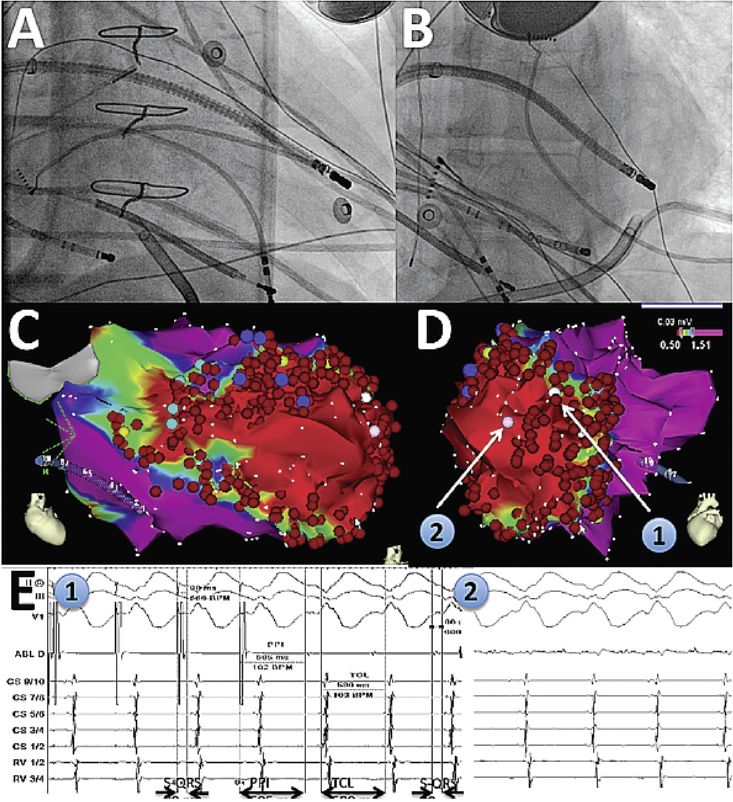
Figure 1.
Catheter ablation of ventricular tachycardia using a robotic system. A and B show right anterior oblique and left anterior oblique fluoroscopic views of the robotic catheter system reaching the LV apex (in particular, the lateral aspect of the apex) where the LV VT substrate was found. An epicardial sheath is also present. C and D show corresponding 3D maps of bipolar endocardial voltage amplitudes, demonstrating a large scar (red). Sites 1 and 2 correspond to the exit site of the VT circuit and its mid-diastolic location, respectively. E1 on the left shows pacing from site 1, with concealed entrainment and post-pacing interval (PPI) identical to the VT cycle length (TCL), and stimulus-to-QRS delay identical to signal-to-QRS (S-QRS). E2 on the right shows a mid-diastolic potential at site 2 during VT.
LV: left ventricular; VT: ventricular tachycardia.

