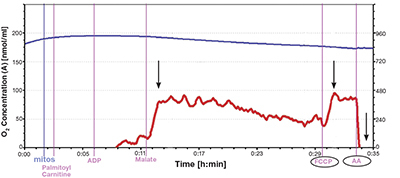
Figure 2.
Representative oxygen tracing from isolated nonfailing human left ventricular wall mitochondria. Using high-resolution respirometry, the oxygen flux rates (red line) are normalized to milligram protein in the isolate. The first arrow denotes the rise in O2 flux (red line) following addition of fatty acid substrate palmitoylcarnitine (PALM CARN), then ADP and MALATE. This is the state 3 rate. The second arrow notes flux rise after uncoupling with FCCP. The ratio of the state 3 [approx. 92 pmol/(s*mg)] to uncoupled [approx. 99 pmol/(s*mg)] give a measure of flux control (approx. 0.92 here). The third arrow highlights the abrupt fall in O2 flux after adding the inhibitor antimycin A. This confirms a functionally intact electron transport chain.

