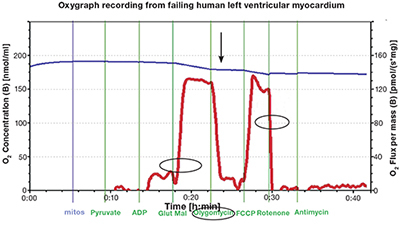
Figure 3.
Representative oxygen consumption tracing from isolated failing left ventricular human mitochondria. O2 flux recording (circled red line) following sequential addition of pyruvate, ADP, and glutamate-malate. This reflects the state 3 rate oxidative phosphorylation. Note the fall of O2 flux (arrow) after addition of oligomycin, an inhibitor of OXPHOS. The next steep rise reflects the addition of mitochondrial uncoupler FCCP (carbonylcyanide p-triflouromethoxyphenylhydrazone). Rotenone, an inhibitor of complex I, causes a rapid drop in the oxygen consumption rate (circled). This supports the conclusion that the mitochondria are coupled with intact ETC chains. Blue line: O2 concentration (nmol/ml); red line: rate of change in rate O2 consumption [pmol/(s*mg)].

