Figure 6.
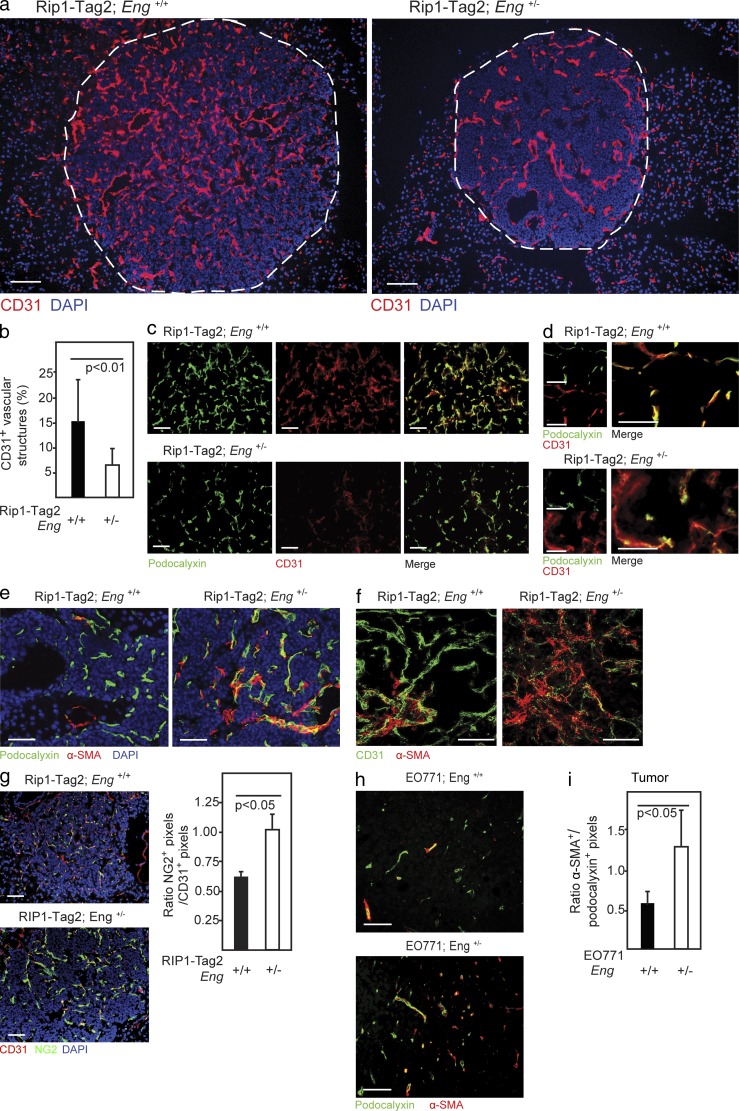
Reduced endoglin expression gives rise to hallmarks of EndMT in tumors in vivo. (a) Immunostaining for CD31 of PNETs from 12-wk-old RIP1-Tag2;Eng+/+ and RIP1-Tag2;Eng+/− mice. The dashed line marks the tumor-exocrine pancreas boundary. (b) Quantification of vessels with high CD31 expression in PNET lesions from RIP1-Tag2;Eng+/+ (n = 3) and RIP1-Tag2;Eng+/− (n = 4) mice. (c and d) Immunostaining for podocalyxin and CD31 of PNET lesions from 12-wk-old RIP1-Tag2;Eng+/+ and RIP1-Tag2;Eng+/− mice. (e) Immunostaining for podocalyxin and α-SMA of PNET lesions from RIP1-Tag2;Eng+/+ and RIP1-Tag2;Eng+/− mice. (f) Representative confocal micrograph of immunostaining for CD31 and α-SMA of PNET lesion from 12-wk-old RIP1-Tag2;Eng+/+ and RIP1-Tag2;Eng+/− mice. (g) Immunostaining and quantification of NG2 and CD31 of sections of PNET from 12-wk-old RIP1-Tag2 mice. (a, e, and g) Cell nuclei are shown with DAPI. (h) Immunostaining for podocalyxin and α-SMA of EO771 tumors grown in Eng+/+ or Eng+/− mice.(i) Quantification of α-SMA+ vessels in EO771 tumors from Eng+/+ (n = 4) and Eng+/− (n = 4) mice. Error bars depict SD. Bars: (a) Bars, 100 µm; (c–h) 50 µm.

