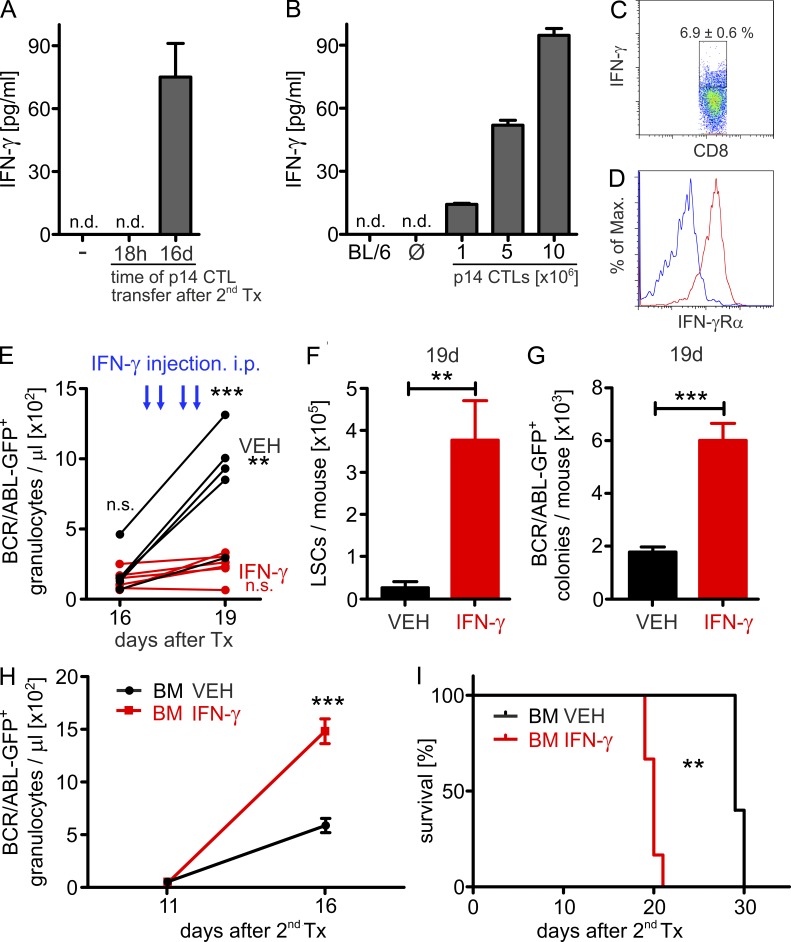
Figure 4.
IFN-γ increases LSC numbers in CML. (A and B) IFN-γ serum levels of CML mice 48 h after p14 CTL treatment. (A) 2 × 10⁴ H8 LSCs were FACS-purified 20 d after primary transplantation and were transferred i.v. into irradiated (6.5 Gy) secondary BL/6 hosts. 18 h or 16 d later, mice were either left untreated (Ø, n = 10, 18h) or treated with 3 × 10⁶ FACS-purified p14 CTLs i.v. (18h: n = 10; 16d: n = 5). (B) H8 CML mice were treated with titrated numbers of MACS-purified p14 CTLs (106, 5 × 10⁶ or 10 × 106 cells) 16 d after primary transplantation or were left untreated (n = 6–7 mice per group). (C) IFN-γ production of BM-infiltrating CTLs in BL/6 hosts that were treated 16 d after secondary LSC transplantation (n = 5). (D) Expression of IFN-γ receptor α chain (IFN-γRα) on H8 CML LSCs. One representative plot of 5 is shown. (E-I) BL/6 CML mice were treated with either vehicle (VEH, n = 5) or 2.5 × 10⁵ U of rm-IFN-γ (n = 6) i.p. twice daily on two consecutive days (days 17 and 18 after primary transplantation). (E) Numbers of BCR/ABL-GFP+ granulocytes/µl blood and (F) LSC numbers were determined on day 19 after transplantation. (G) Equal numbers of lin− cells were plated in methylcellulose and BCR/ABL-GFP+ colonies were enumerated 7 d later by fluorescence microscopy. (H-I) 3 × 10⁶ BM cells from vehicle-treated (black line, n = 5) or IFN-γ–treated (red line, n = 6) BL/6 CML mice were secondarily transplanted into irradiated (4.5 Gy) BL/6 mice. (H) Numbers of BCR/ABL+ granulocytes/µl blood and (I) Kaplan-Meier survival curves resulting from secondary transplantations. Data are displayed as mean ± SEM. Statistics: Student’s t test (F and G), two-way ANOVA (E and H), log-rank test (I). *, P < 0.05; **, P < 0.01; ***, P < 0.0005.

