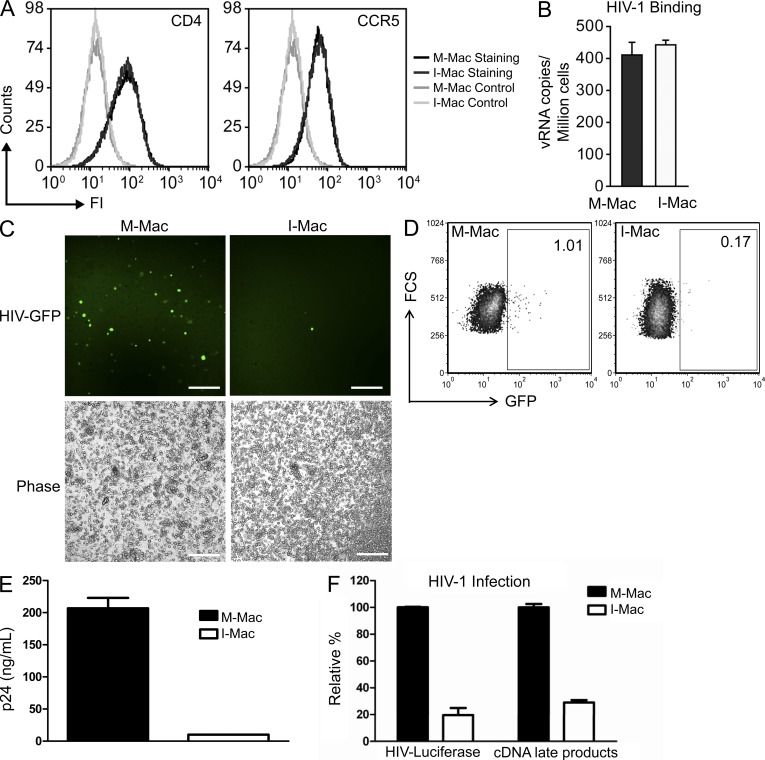
Figure 2.
HIV-1 infection of I-Mac is blocked after entry and before reverse transcription of viral cDNA. (A) M-Mac and I-Mac were analyzed for CD4 and CCR5 expression by FACS. (B) M-Mac and I-Mac were incubated with HIV-1BAL on ice for 1 h to allow virus binding. Virus attachment was determined by measuring the copy number of HIV-1 RNA bound to the cells. Data shown represent means ± SE of three independent experiments. (C) M-Mac and I-Mac were infected with HIV-EGFP-V. (left) Infected cells were examined with fluorescent microscopy. Bar, 200 µm. (D) GFP+ cells were analyzed by FACS 4 d after infection. (E) p24 antigen amount was measured by ELISA. Data shown represent mean ± SD of triplicate infection samples. (F) M-Mac and I-Mac were infected with HIV-LUC-V. Viral cDNA copy number and luciferase activity was measured 48 h after infection. Data shown represent mean ± SE of three independent experiments.

