Fig. 3.
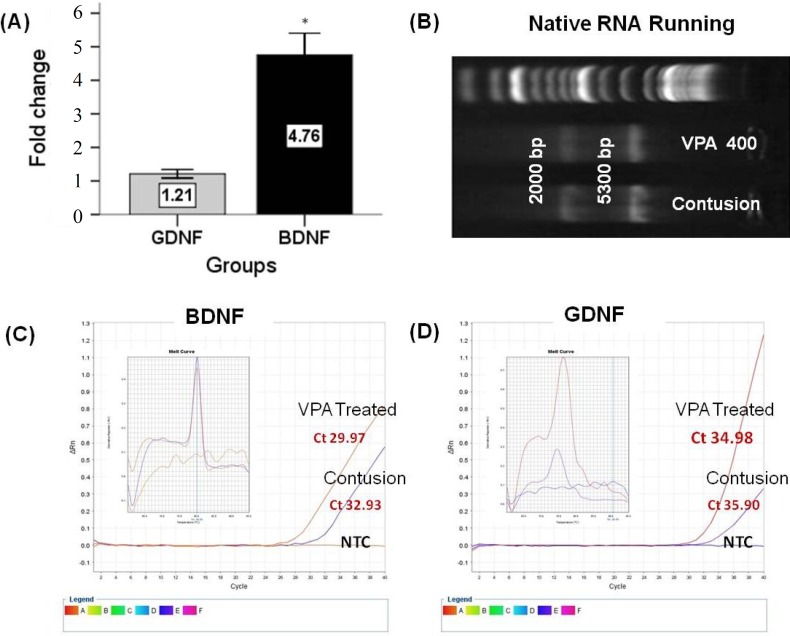
Fold change ratio of glial cell-derived neurotrophic factor (GDNF) and brain-derived neurotrophic factor (BDNF) mRNA. Real-time PCR results are presented as relative expression normalized to B2M mRNA amplification. (A) Amplification of BDNF and GDNF mRNA derived from 400 mg/kg VPA-treated and -untreated groups 28 days post injury showing increased levels of both mRNA after 400 mg/kg VPA treatment. The results demonstrate significant differences between BDNF and GDNF mRNA levels. (B) Total RNA analyzed on a 1.5% denaturing agarose gel. The 18S and 28S ribosomal RNA bands were clearly visible in the intact RNA sample. (C and D) The amplification plot and melting curves for both amplification products. Bar graphs indicate the mean ± SEM. *P<0.05.

