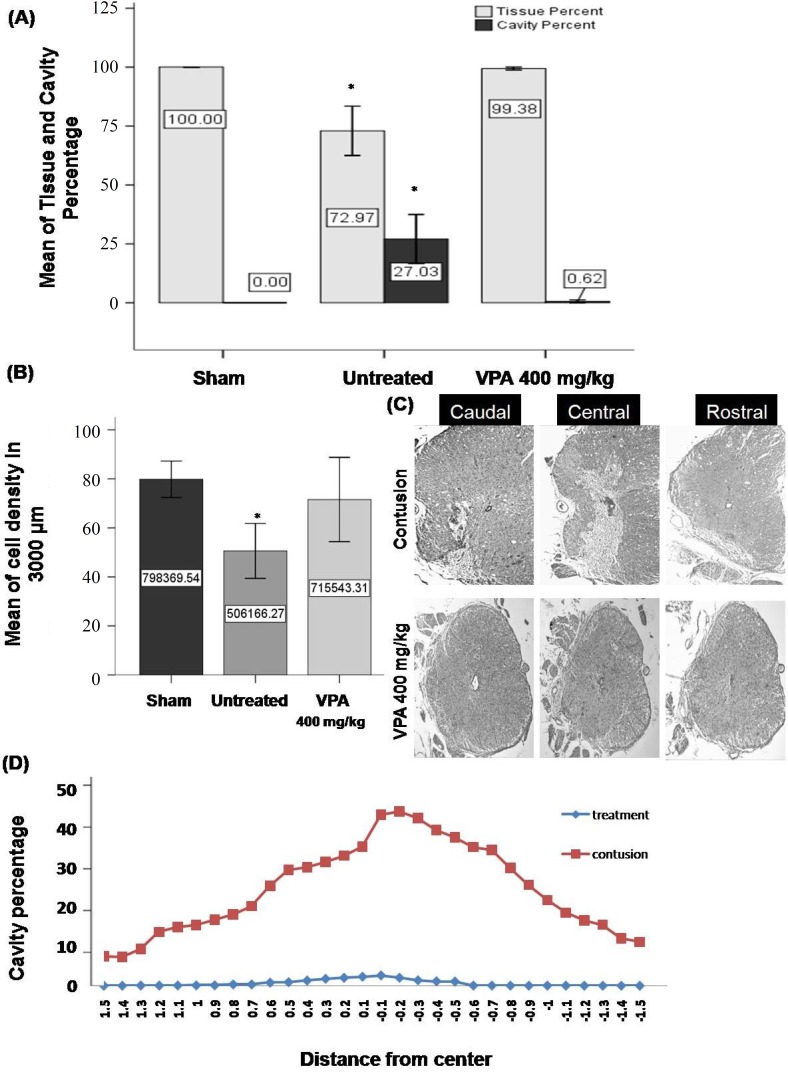
Fig. 4.
Quantification of cell density and cavity percentage in gray and white matter 28 days post injury. (A and B) Means of cavity percentage (A) and cell density (B) in the 3000 µm length of injured spinal cord. Significant differences between 400 mg/kg VPA-treated and -untreated SCI groups, but not between the sham control and 400 mg/kg VPA-treated group. (C and D) Representative photomicrographs and line graphs showing the lesion extending from the epicenter rostrally end caudally. A massive destruction of gray matter and tissue loss at the epicenter in the untreated SCI group was seen in comparison to 400 mg/kg VPA-treated group. From epicenter to caudally and rostrally increase of tissue density and decrease of cavity percentage is seen. 4x magnification; Bar graphs indicate mean ± SEM; *P<0.05 (untreated group compared to sham control and 400 mg/kg VPA groups).

