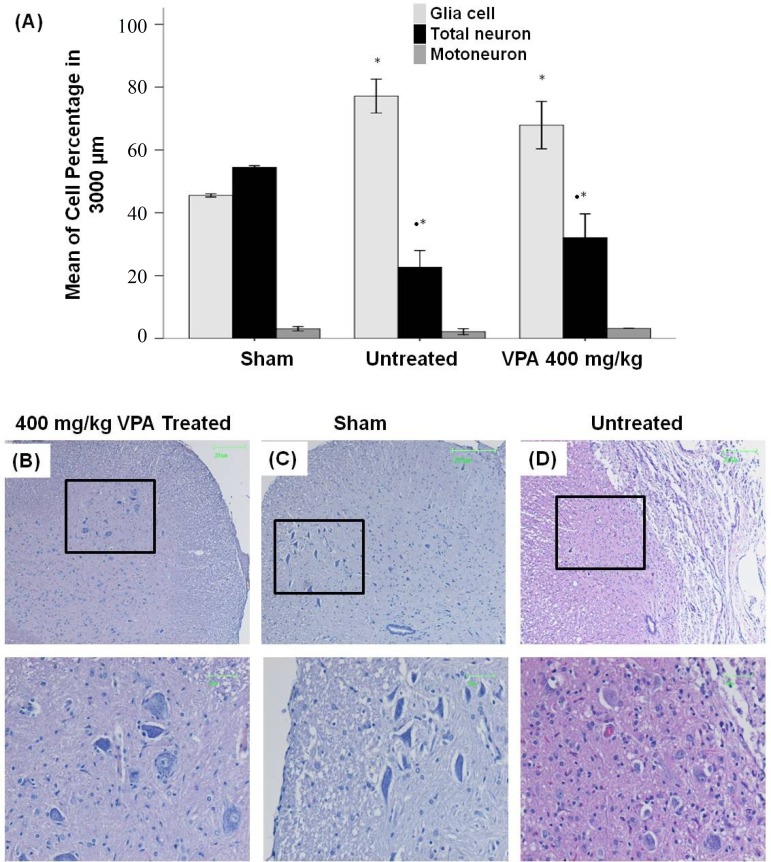
Fig. 5.
Quantification of cell percentage in gray and white matter 28 days post injury. (A) Graph shows a significant increase of glial cells and decrease of neuronal cell percentages in untreated SCI and 400 mg/kg VPA-treated groups compared to the sham control group. (B, C and D) Representative hematoxylin/eosin stained photomicrographs showing the cell population in ventral horn of the spinal cord in VPA 400 mg/kg treated (B), sham control (C) and untreated (D) groups. Scale bar 50 and 200 µm; Bar graphs indicate the mean ± SEM; *P<0.05 (compared to 400 mg/kg VPA groups); **P<0.05 (compared to sham control group).

