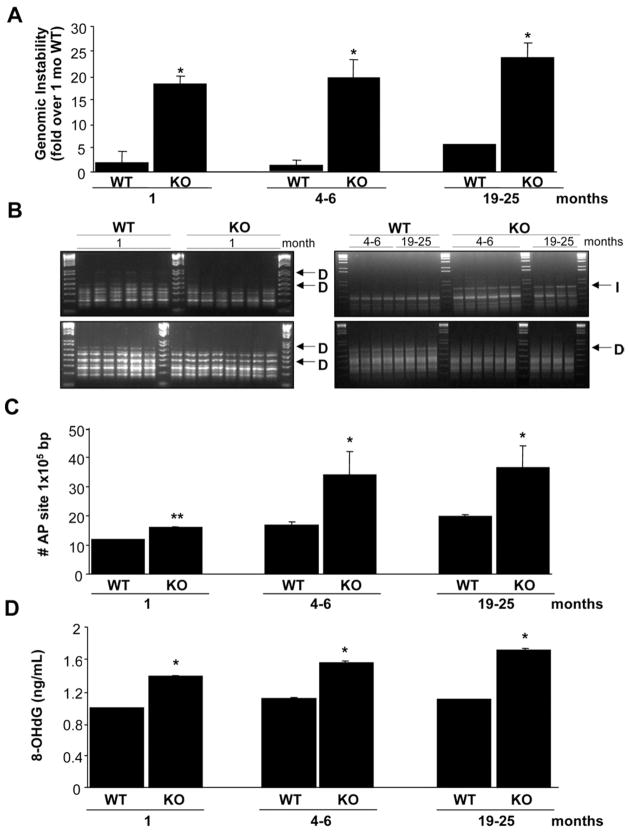
Figure 1.
Increased genomic instability in Mat1a KO mice. (A) The percentage of genomic instability in liver was calculated in different age groups of Mat1a KO and WT mice as described in the Materials and Methods section. Results are expressed as fold over results from 1-monthold WT mice (mean ± SEM) from 3 to 6 mice per group. *P < .001 vs respective WT. (B) The RAPDPCR analysis of KO mouse livers (KO) and corresponding normal liver tissue DNA from WT mice (WT) with same primers. Each lane represents sample from one mouse. Genetic alterations are indicated by arrows: D, deletion, I, insertion. The 1.5-kilobase (kb) ladder was used as a control marker. (C) The number of AP sites per 105 base pairs was detected in DNA obtained from livers of different age groups of Mat1a KO and WT mice. Results are expressed as absolute number of AP sites per 105 base pairs (mean ± SEM) from 3 mice per group. *P < .001, **P < .05 vs respective WT. (D) Amount of oxidative DNA damage was assessed in each age group by measuring 8-OHdG as described in the Materials and Methods section. *P < .001 vs respective WT.

