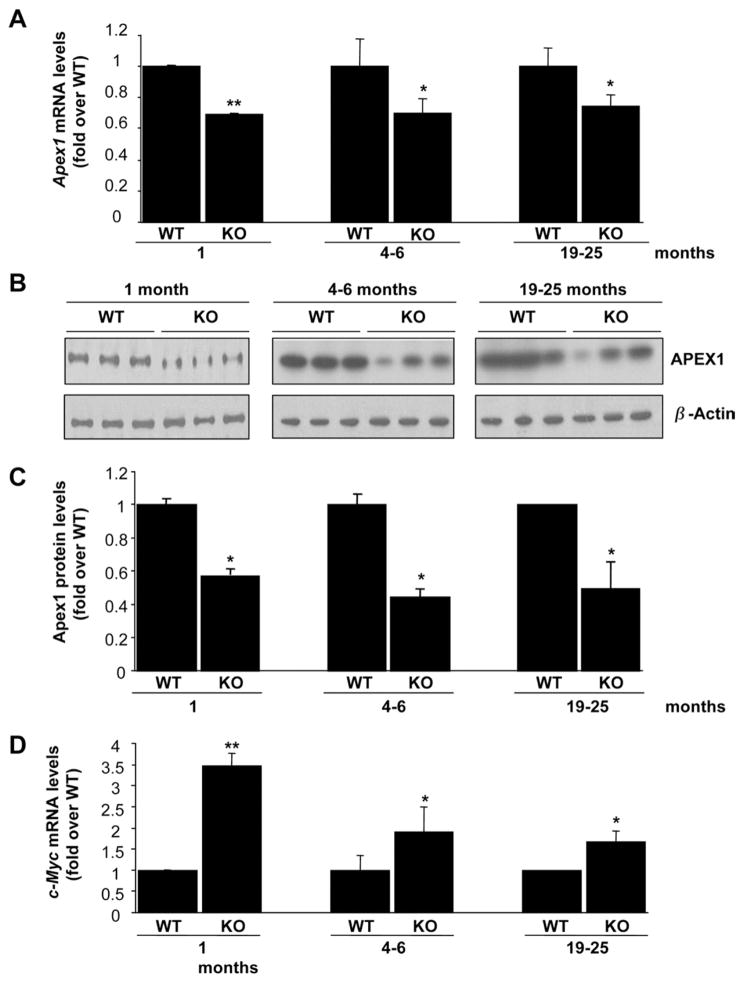
Figure 2.
Apex1 and c-Myc expression in Mat1a KO mice. (A and D) RNA from livers of different age groups of Mat1a KO and WT mice was subjected to quantitative real-time PCR analysis for Apex1 (A) and c-Myc (D) as described in the Materials and Methods section. Results are expressed as fold over respective WT mice (mean ± SEM) from 3 to 5 mice per group. *P < .05, **P < .001 vs respective WT. (B) Western blot analyses for APEX1 and β-actin were done using 10 μg of tissue extracts from livers of different age groups of Mat1a KO and WT mice. (C) Results are expressed as fold over respective WT mice (mean ± SEM) from 3 to 4 mice per group. *P < .002 vs respective WT.

