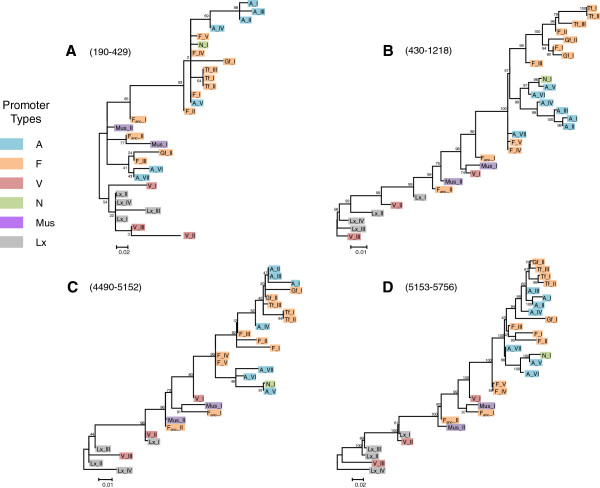
Figure 3.
Phylogenetic trees of mouse L1 families based on (A) the coiled coil domain, (B) the 3’ end of ORF1 and the 5’ terminus of ORF2, (C) the 3’ terminus of ORF2 and the 5’ end of the 3’UTR and (D) the 3’ terminus of the 3’UTR. The trees were built with the maximum-likelihood method using the JC (tree A), TN93+G (B), HKY+G (tree C) or T92 (tree D) models. The numbers indicate the percentage of time the labeled node was present in 1,000 bootstrap replicates of the data. The numbers in parentheses correspond to the position of the fragments used to build the tree relative to the alignment provided as supplementary material and beginning at position 1 of ORF1.

