Abstract
The purpose was to study the toxicity of cadmium (Cd) and to explore its potential to generate nanoparticles during detoxification. In order to demonstrate this, in vivo fluorescence imaging, X-ray diffraction, and flow cytometry were performed. The in vivo imaging showed a fluorescence signal after Cd treatment (CdCl2, 1.50 mg/Kg, intraperitoneally). By contrast, the control-rat fluorescence was negative. The fluorescence was divided into three colors, red, yellow, and green, and probably indicates the presence of quantum dots. X-ray diffraction results revealed the presence of Cd sulfide (CdS) and/or Cd selenide (CdSe) nanoparticles following Cd injection in the liver (6.52 nm) and kidneys (56.30 nm). Interestingly, flow cytometry revealed a heterogeneous size distribution and a homogeneous granularity of synthesized nanoparticles. Using the green fluorescence channel and the red fluorescence channel, a narrow green emission spectrum and a broad red emission spectrum were detected, respectively, by cytometric analysis.
Keywords: XRD, in vivo imaging, flow cytometry, quantum dots, cadmium sulfide, cadmium selenide
Introduction
Cadmium (Cd) is an important environmental pollutant and all Cd compounds have been classified as human carcinogens.1 Sources of human exposure to this metal include food, cigarette smoke, and alcoholic beverages.2 Cd influences many metabolic processes, causing great damage to many organs. Ingested Cd is mainly translocated to the kidneys and liver. The liver has been reported to play an active role in rapidly removing Cd ions from blood. Cd is retained in the liver, with a long biological half-life and causes a variety of toxic responses by hepatic cells.3,4 The molecular mechanism responsible for the toxic effect of Cd is not well understood. Various studies connect Cd with oxidative stress, since this metal can alter the antioxidant defense system in several animal tissues. Studies on mammals have shown that Cd stimulated the formation of reactive oxygen species.5,6 The main target organs for Cd accumulation are the liver and kidneys,7 where it induces metallothionein (MT) synthesis,6–8 but almost every other organ of the body can accumulate Cd to a certain extent. However, as far as we know, there have been no studies investigating whether Cd toxicity is related to its potential to generate nanomaterial at the cellular level.
Nanoparticles are colloidal-sized particles, possessing diameters ranging between 1 and 100 nm. Nanomaterials are highly promising candidates for various important biological applications, such as gene delivery,9,10 cellular imaging,11,12 and tumor therapy.13 In general, nanoparticles can be categorized into carbon-based materials, such as fullerenes and carbon nanotubes, and inorganic nanoparticles, including ones based on metal oxides (for eg, zinc oxide, iron oxide, titanium dioxide, cerium oxide, etc), metals (for eg, gold silver, and iron), and quantum dots (QDs) (for eg, Cd sulfide [CdS] and Cd selenide [CdSe]). QDs are fluorescent semiconductor nanocrystals (2–10 nm), characterized by unique physical, chemical, and optical properties.14
QDs possess excellent optical properties, including high fluorescent quantum yield broad absorption/narrow emission, and high photostability15,16
Interestingly, CdS or CdSe nanocrystals are mainly synthesized by physical and chemical procedures,17,18 but biological synthesis remains scarce or nonexistent as far as we know. However, many investigations are showing an increased interest in green nanoparticles biosynthesis, which has been revealed in bacteria and fungi.19–24 In bacteria, we can distinguish the intracellular biosynthesis of CdS nanocrystals in Klebsiella pneumoniae (5–200 nm)19 and Escherichia coli (2–5 nm),20 and extracellular biosynthesis in Klebsiella aerogenes (20–200 nm),21Rhodopseudomonas palustris (8 nm),22 and Gluconoacetobacter xylinus (30 nm).23 Among fungi, Fusarium oxysporum is able to synthesize spherical CdSe nanocrystals ranging from 9 to 15 nm in size.24 The green biosynthesis of Cd-containing nanocrystals is due to the ability of some microorganisms to resist heavy metals via the reduction and the precipitation of soluble metallic ions, producing insoluble nanometric complexes.25
The aim of our investigation was to better understand Cd toxicity, in terms of nanoparticle biosynthesis in rats.
Material and methods
Animals
Adult Wistar male rats (SIPHAT, Bin Arous, Tunisia), weighing 150–170 g (12-weeks-old) at the time of study, were randomly divided into a control rat group (n = 6), and a Cd-treated group (n = 6). The animals were housed at 25°C, under a 12-hour-light/12-hour-dark cycle, with free access to water and commercial mash. The animals were cared for according to the Tunisian Code of Practice for the Care and Use of Animals for Scientific Purposes. The experimental protocols were approved by the Faculty Ethics Committee (Faculté des Sciences de Bizerte, Tunisia).
Cd treatment
Cd chloride (CdCl2) was purchased from Sigma-Aldrich Chemical (St Louis, MO, USA). The control group was intraperitoneally injected once with 0.10 mL of 0.9% saline solution. The Cd-treated group was intraperitoneally injected once with a sublethal dose of Cd (1.50 mg Cd/kg of body weight).6
In vivo fluorescence imaging and image processing
Fluorescence Imaging was carried out 30 days after the intraperitoneal injection, in the Photo Laboratory (Faculté des Sciences de Bizerte). The equipment used was developed with scientific and technical support with “Innovative Start Up” (Bizerte Tunisia).
Photos were done in absolute darkness with an adapted schedule. The animals were anesthetized with diethyl ether and placed in supine position. Image processing was carried out with ImageJ software (National Institute of Mental Health, Bethesda, MD, USA).26
Powder sample preparation
At 30 days postintraperitoneal injection, the control and treated groups were sacrificed and organs (liver and kidneys) harvested. The tissues were weighed rinsed with ice-cold deionized water, and dried with filter paper. Liver or kidney fractions were dried for 5 days at 50°C. The fractions were mixed and sieved in order to obtain powder.
X-ray diffraction (XRD) measurements
XRD measurements were carried out on a Bruker D8 advance powder X-ray diffractometer (Bruker Corp, Billerica, MA, USA) using Cu Kα (λ = 1:5402 Å) as an incident radiation, with a scan range of 20 < 2θ < 60.
Flow cytometric analysis
The powders were added in 500 mg/L solutions of deionized water. The obtained solutions were immediately vortexed and filtered with a 0.20 μm filter to eliminate aggregates.
The size, fluorescence, and granularity of particles were characterized using a FACSCalibur™ flow cytometer (BD Biosciences, San Jose, CA, USA). The FACSCalibur was fitted with two excitation sources, a 488 nm air-cooled argonion laser and a 632 nm red diode laser, and used Cell Quest Pro™ software v2.2 (BD Biosciences). Forward scatter (FSC) and side scatter (SSC) optical signals, which respectively represent the size and granularity of particles, were acquired in logarithmic scale (for FSC) and linear scale (for SSC), using the primary data acquisition mode. The intensity of fluorescence emission was detected on four separate detectors labeled FL1, FL2, FL3, and FL4, each with its own set of wavelength filters, and data were presented in the form of histograms. Events were acquired by using collection criteria of the software either to stop acquisition after 150,000 events were acquired (event limit) or after 120 seconds had elapsed (time limit). All fluorescence data were collected using four-decade logarithmic amplification.
In the present study, we used the blue laser (488 nm) and especially, the emission detected in FL1 and FL3. The results are representative of three independent experiments. For statistical analysis, data were analyzed using Stat View 512+ software (Abacus Concepts Inc, Piscataway, NJ, USA). Means were given with ± standard error of the mean, and differences between the controls and treated samples were determined by Student’s t-test. The level of significance was set at P = 0.05. The flow cytometric settings used for the size distribution analysis of biosynthesized nanoparticles are presented in Table 1.
Table 1.
Flow cytometer settings used in the analysis
| Threshold
|
FSC-H | SSC-H | FL1-H | FL2-H | FL3-H | |
|---|---|---|---|---|---|---|
| FL1 | FL3 | |||||
| 141 | 52 | E02 | 903 | 532 | 550 | 650 |
Notes: All gains were logarithmic except for those for SSC, which were linear. Values are expressed as volts.
Abbreviations: SSC, side scatter optical signals; FSC, forward scatter optical signals; FL1, green fluorescence channel; FL2, orange fluorescence channel; FL3, dark red fluorescence channel; H, height of voltage pulses.
Results
In vivo fluorescence imaging and image processing
Fluorescence imaging carried out on the control group revealed the absence of a fluorescence signal at the abdominal side of control rats (Figure 1A). However, a fluorescence signal was observed at the right side of the image of the Cd-treated rats (Figure 1B). The fluorescence was divided into three different colors: red, yellow, and green.
Figure 1.
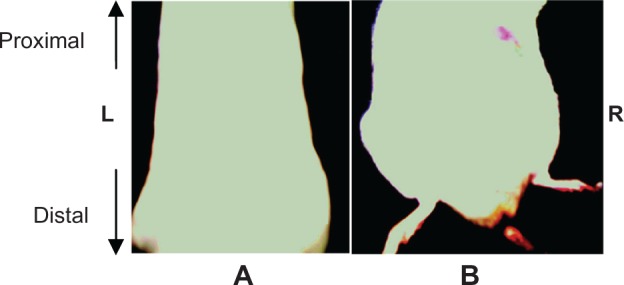
Abdominal side fluorescence imaging of control rat (A) and Cd-treated rat (B).
Abbreviations: Cd, cadmium; L, Left; R, Right.
Figure 2B shows an enlargement of the fluorescence signal. The first step in image processing was to extract background by adjusting the threshold at 100 pixels and by setting the median filter at 7 pixels.
Figure 2.
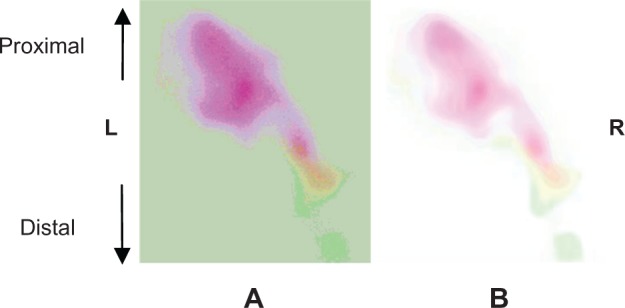
Enlargement of the fluorescence detected at the right side of the abdomen of the Cd-treated rat before (A) and after (B) filter setting.
Abbreviations: Cd, cadmium, L, left; R, Right.
XRD characterization
XRD patterns give information about crystalline structure, grain size, and strain. Figures 3 and 4 show, respectively, the XRD patterns of the powder prepared from liver and kidney fractions. For control groups, Figures 3 and 4 show that the XRD peak was found at 2θ value of 21.28°, referring to the diffraction of silica nanoparticles in both organs. The average silica nanoparticle size was determined to be ~8.80 nm from the full width at half maximum (FWHM) of the most intense peak, making use of the Scherrer’s equation:
Figure 3.
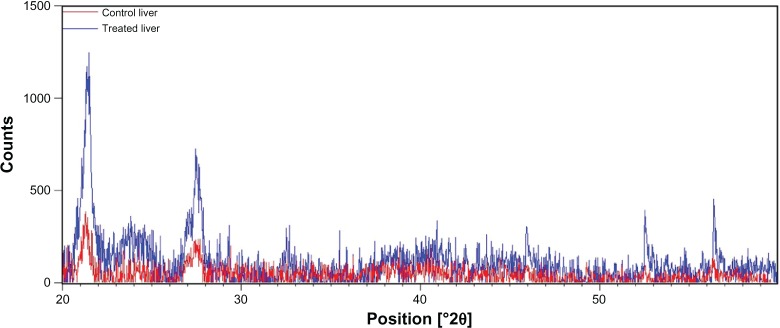
X-ray diffraction pattern of the liver fraction powder from control rats (red) and Cd-treated rats (blue).
Abbreviation: Cd, cadmium.
Figure 4.
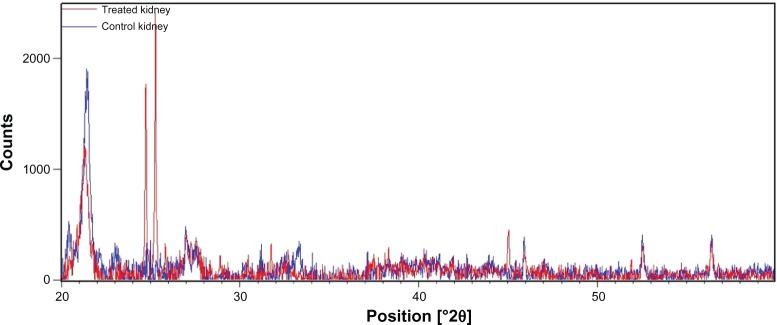
X-ray diffraction patterns of the kidney fraction powder from control rats (red) and Cd-treated rats (blue).
Abbreviation: Cd, cadmium.
| (1) |
where λ is the wavelength of the X-ray radiation, β is the FWHM in radians of the XRD peak, and θ is the angle of diffraction.
Interestingly, the X-ray pattern of the liver powder harvested from the Cd-treated rats showed three new peaks compared with the X-ray pattern of the control rats (Figure 3).
New peaks were observed at 2θ = 24.09°, 2θ = 40.35°, and 2θ = 52.70°, indicating the diffraction of cubical zinc blende CdS nanoparticles with a 6.52 nm size range.27–29 Moreover, the X-ray pattern of powder prepared from the kidney fractions of Cd-treated rats showed five new peaks compared with the X-ray pattern obtained with the control group (Figure 4).
New peaks were observed, respectively, at 2θ values of 24.71°, 25.26°, 25.82°, 38.41°, and 44.73°, indicating hexagonal CdS nanoparticles of 54.14 nm.27–29
Flow cytometric characterization
For the flow cytometric analysis, the FSC and SSC parameters of the samples were acquired and displayed in the histogram acquisition (Figure 5). For control group, the number of analyzed events obtained with liver was about 695 events and for kidneys, were about 1450 events.
Figure 5.
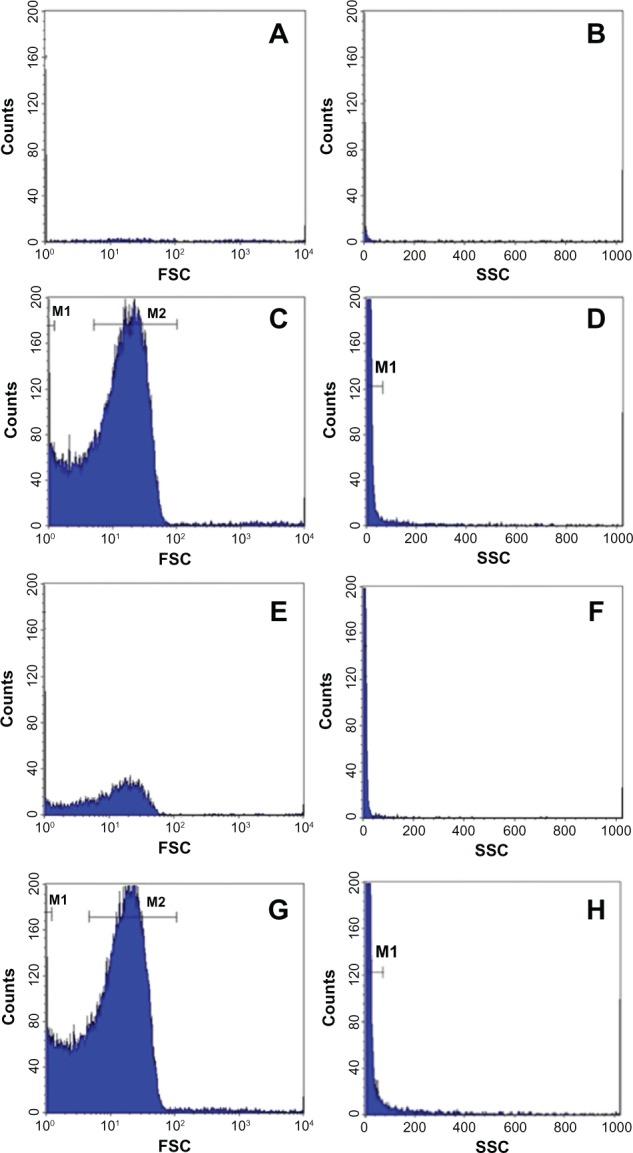
Histograms of the analyzed solutions of liver-fraction powder from the control group (A and B) and of Cd-treated group (C and D). Histograms of the analyzed solutions of kidney-fraction powder from the control group (E and F) and Cd-treated group (G and H).
Notes: The results were representative of three independent experiments. Events were acquired for 120 s at a constant flow rate. The FSC histograms showed a bimodal distribution with two peaks M1 and M2 for the Cd-treated groups (C and G). The SSC histograms showed a unimodal distribution of detected events with a single narrow peak M1 attached to counts scale (D and H).
Abbreviations: Cd, cadmium; FSC, forward scatter optical signals; SSC, side scatter optical signals.
However, for the Cd-treated group, the number of analyzed events increased (121,100 vs 695 events) (P < 0.01) in the liver and (139650 vs 1450) (P < 0.01) in the kidneys. For the FSC parameter, a bimodal distribution was observed, with a narrow peak, M1, and a broad peak, M2, in the histograms of liver or kidney solutions (Figure 5C and G). These peaks represent 88.22% of total events in the liver solutions and 88.80% in the kidney solutions. However, for the control group, no peak was observed in the analyzed solutions. Moreover, the SSC parameters exhibited a single unimodal distribution. A narrow peak M1 was observed in the histograms of the analyzed solutions of Cd-treated group. This peak represents 98.91% and 98.38% of total events, respectively in the liver and kidneys. In order to evaluate the background of the deionized solution, many tests were done. Results showed a low level of green and red fluorescence detected in the R1 and R3 regions of the dot plots obtained with analyzed solutions of the control rats (Figure 6A and C). This result was confirmed by FL1 and FL3 histograms (Figure 7), which showed the absence of fluorescence in the liver solution of control rats and a low average of fluorescence in the kidney solution of the same group.
Figure 6.
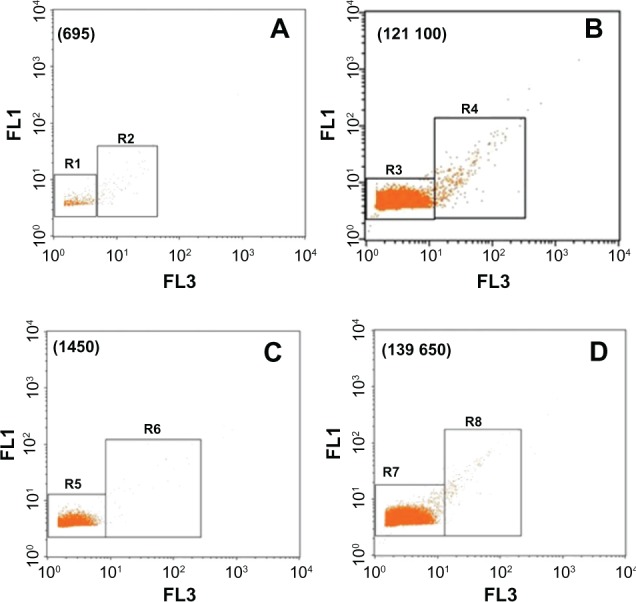
Dot plots representing the FL1 and FL3 parameters. (A and C) represent the dot plots obtained with control group, in liver and kidneys, respectively; and (B and D) represent the dot plots obtained with Cd-treated group, in liver and kidneys, respectively.
Notes: Events were mostly detected in R3 for liver solution and R7 for kidneys solution. Number of analyzed events is stated within brackets. The results were representative of three independent experiments. Events were acquired for 120 s at constant flow rate.
Abbreviations: FL1, green fluorescence channel; FL3, dark red fluorescence channel; Cd, cadmium; r3, region 3.
Figure 7.
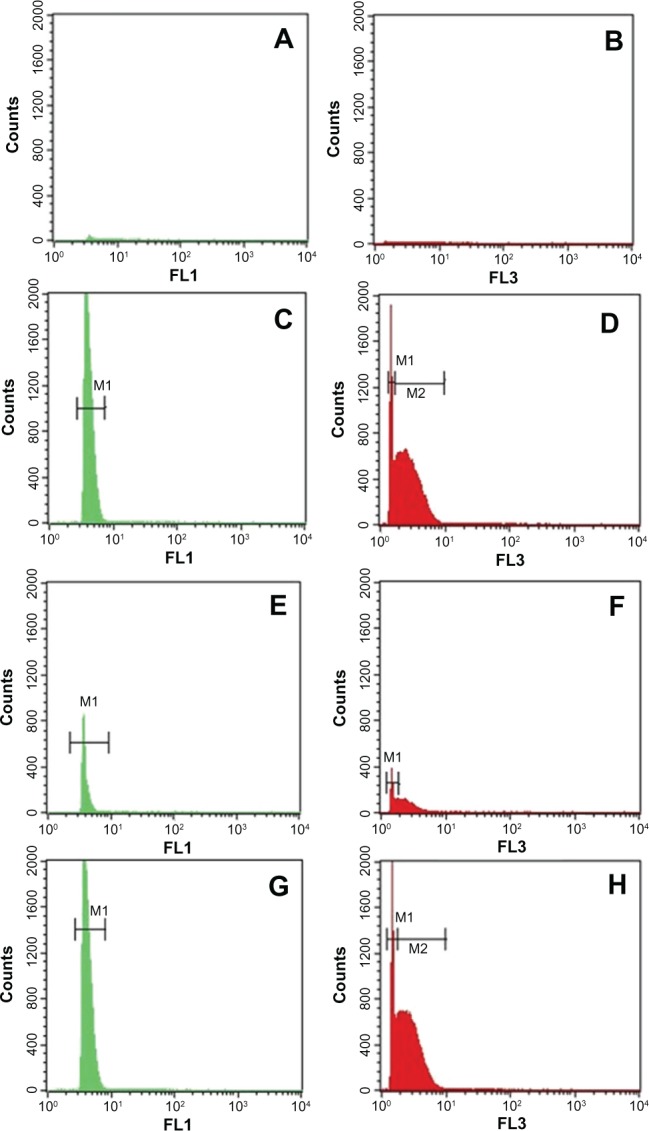
Dot plots of the analyzed solutions of liver-fraction powder from the control group (A and B) and the Cd-treated group (C and D). Dot plots of the analyzed solutions of kidney-fraction powder from the control group (E and F) and the Cd-treated group (G and H).
Notes: FL1 showed a unimodal distribution with a single peak M1 in liver or kidneys solutions (C and G). However, FL3 revealed a bimodal distribution with two peaks, M1 and M2 (D and H). The results were representative of three independent experiments. Events were acquired for 120 s at constant flow rate.
Abbreviations: Cd, cadmium; FL1, green fluorescence channel; FL3, dark red fluorescence channel; Cd, cadmium; M1, peak M1; M2, peak M2.
By contrast, according to the dot plots representations (Figure 6B and D), the majority of nanoparticles populations were found to be distributed in the R3 region for the liver solution of Cd-treated rats and in the R7 region for the kidney solution of the same group. Moreover, the FL1 histogram exhibited a single unimodal distribution. A narrow M1 peak was detected with FL1 in the liver and kidney solutions.
This peak represents 99.67% of total events, with a fluorescence average of 4.15 for the liver solution, and 99.63% of total events and a fluorescence average of 4.21, for kidneys solution (Figure 7C and G). For the FL3 parameter, a bimodal distribution was recorded. Two peaks, M1 and M2, were observed in the histograms obtained with the Cd-treated group. M1 and M2 do not have the same width; M2 is broader than M1, but they represent more than 90% of total events (Figure 7D and H).
Discussion
In our study, Wistar male rats were intraperitoneally treated with CdCl2 (1.50 mg/kg body weight) in order to better understand Cd toxicity. In vivo imaging revealed a fluorescence signal characterized by red, yellow, and green emissions. The presence of fluorescence (red, yellow, and green) points to the eventual biosynthesis of QDs, as CdS and/or CdSe, in tissues.
In order to confirm this hypothesis, XRD was performed. The Cd treatment induced modifications in the X-ray patterns, which revealed the synthesis of CdS and/or CdSe, respectively, in the liver and kidneys. Multiple peaks showed the polycrystalline nature of the analyzed powders.27 No investigation has yet revealed the biosynthesis of nanoparticles in superior organisms, in vivo at 37°C, as far as we know. In addition, 2θ values found in our study were almost the same as those observed after chemical synthesis, as reported in many studies.27–29 We postulate that the differences observed in 2θ values compared with chemical synthesis were due to the temperature variation – from high degrees during the chemical synthesis to 37°C with the biosynthesis. The size uniformity distribution and size average can be affected by a temperature synthesis variation of even less than 1°C,30 which has also been reported in other studies.30,31 The broadening of diffraction peaks gives information about the crystallite size. As width increases, the particle size decreases, while as width decreases, particle size increases.32
In fact, CdSe and CdS nanoparticles were characterized by size-dependent photoluminescence colors, which were distributed throughout the visible region of the electromagnetic spectrum.33,34
The emission maximum of semiconductor nanocrystals can be tuned precisely by adjusting the size of QDs. Smaller QDs emit light with shorter wavelengths than larger particles.
For example, the emission maxima of CdSe nanocrystals of 3 and 7 nm diameter are approximately 550 and 650 nm, respectively.35 Thus, red-emitting nanoparticles are larger than yellow-emitting and green-emitting nanoparticles are smaller than yellow-emitting nanocrystals. In our study, the size of nanoparticles found in the liver (6.52 nm) represent the average of red-emitting, yellow-emitting, and green-emitting quantum dot sizes. Moreover, the size range of nanoparticles found in the kidneys was about 54.14 nm, indicating a probable agglomeration of nanoparticles related to histological properties of the nephrocytes.
The color transition of the fluorescence signal shows the size-dependent distribution of the biosynthesized nanoparticles. Nanoparticles size decreased from the central area (red color) to the peripheral zone (green color) of the signal. This size-dependent in vivo distribution of manufactured QDs has been confirmed in other investigations.36,37
Anatomical localization of the fluorescence suggests that the liver was probably the origin of the emitting signal. Interestingly, Cd is known to interfere with intracellular thiol groups by direct binding. Indeed, CdS nanoparticles synthesis can be explained by the induction of MT, a family of cysteine-rich, low molecular weight proteins.6,38 Cd ions are bound by MT via thiol groups of cysteine residues, leading to the formation of Cd-MT complexes.39,40 We postulate that CdS nanoparticles could have the same structure as Cd-MT complexes. Furthermore, it’s known that Cd treatment induces the depletion of glutathione due to direct binding of the metal with this antioxidant enzyme via thiol groups.6
In addition, other studies have investigated the interactions between selenium (Se) and Cd in biological systems,41,42 but as far as we know, none have revealed the generation of nanosized CdSe complexes in the cells of superior organisms. Se has been shown to reduce the Cd level in blood, leading to insoluble complexes.42
Complexation reactions depend on the nature of either mineral or organic Se Mineral forms of Se (selenite) lead to less soluble complexes than do organic forms (seleno-urea).43 Moreover, there is increasing evidence that Cd interacts with Se and disrupts glutathione peroxidase activity.5,6
Based on the physical mechanisms of flow cytometry, characterization of QDs by FACSCalibur could be an innovative approach. In fact, flow cytometry results showed a heterogeneous size distribution of nanoparticles biosynthesized in the liver and kidneys of Cd-treated rats. This result was confirmed by FSC histograms, which gives information about size. In fact, two peaks, M1 and M2, were observed, indicating that biosynthesized nanoparticles of different sizes; the nanoparticle population represented by M1 were smaller than those represented by M2, according to the FSC values.
A similar result was reported with baculovirus aggregates, which are categorized as nanoparticles.44 In addition, the SSC histograms showed that nanoparticles had homogeneous granularity. This result was confirmed by the presence of a single narrow M1 peak. This peak was observed at very low values of SSC, thus, the peak was attached to the counts scale. The previous result can be explained by the detection limit of flow cytometry in the characterization of nanosized particles. A few earlier studies have attempted to evaluate submicron particles, like liposomes45,46 and silica nanoparticles,47 by flow cytometry; scatter signals emanating from them were not distinct from background noise, thus rendering their analysis unconvincing and difficult.
The fluorescence data, represented in histograms (Figure 7), showed a unimodal distribution with a single narrow peak in FL1. This result shows that the biosynthesized nanoparticles had a narrow green emission spectrum. A similar unimodal distribution was reported with single baculovirus.44 It is important to consider viruses as nanoparticles because their sizes vary between 1 and 100 nm. A bimodal distribution was observed with red fluorescence, indicating that the red-emitting nanoparticles had a broad red emission spectrum and confirming that the nanoparticles had different sizes. In fact, the narrow peak corresponds to single nanosized particles; however, the broader peak corresponds to larger aggregates of nanoparticles with high-intensity fluorescence. The same fluorescence representation was observed with single and aggregate baculovirus.44
In conclusion, firstly, we demonstrated that the interaction of Cd with organs (liver and kidneys) led to fluorescence ranging from red to green, indicating a probable presence of nanoparticles, especially QDs. Secondly, all techniques used in the present study point to the nucleation of nanoparticles containing Cd. Interestingly, the Cd complexation in the different cells could be considered as a green biosynthesis of QDs.
Footnotes
Disclosure
The authors report no conflicts of interest in this work.
References
- 1.International Agency for Research on Cancer (IARC) Monographs on the Evaluation of Carcinogenic Risks Humans, Vol 58: Beryllium, Cadmium, Mercury, and Exposures in the Glass Manufacturing Industry. Geneva: World Health Organization; 1993. Available from: http://monographs.iarc.fr/ENG/Monographs/vol58/mono58.pdf. [PMC free article] [PubMed] [Google Scholar]
- 2.Järup L, Berglund M, Elinder CG, Nordberg G, Vahter M. Health effects of cadmium exposure – a review of the literature and a risk estimate. Scand J Work Environ Health. 1998;24(Suppl 1):S11–S51. [PubMed] [Google Scholar]
- 3.Koyu A, Gokcimen A, Ozguner F, Bayram DS, Kocak A. Evaluation of the effects of cadmium on rat liver. Mol Cell Biochem. 2006;284(1–2):81–85. doi: 10.1007/s11010-005-9017-2. [DOI] [PubMed] [Google Scholar]
- 4.Yiin SJ, Chern CL, Sheu JY, Lin TH. Cadmium-induced liver, heart, and spleen lipid peroxidation in rats and protection by selenium. Biol Trace Elem Res. 2000;78(1–3):219–230. doi: 10.1385/BTER:78:1-3:219. [DOI] [PubMed] [Google Scholar]
- 5.Amara S, Abdelmelek H, Garrel C, et al. Influence of static magnetic field on cadmium toxicity: study of oxidative stress and DNA damage in rat tissues. J Trace Elem Med Biol. 2006;20(4):263–269. doi: 10.1016/j.jtemb.2006.07.002. [DOI] [PubMed] [Google Scholar]
- 6.Chater S, Douki T, Garrel C, Favier A, Sakly M, Abdelmelek H. Cadmium-induced oxidative stress and DNA damage in kidney of pregnant female rats. C R Biol. 2008;331(6):426–432. doi: 10.1016/j.crvi.2008.03.009. [DOI] [PubMed] [Google Scholar]
- 7.Matsubara-Khan J, Machida K. Cadmium accumulation in mouse organs during the sequential injections of cadmium-109. Environ Res. 1975;10(1):29–38. doi: 10.1016/0013-9351(75)90071-7. [DOI] [PubMed] [Google Scholar]
- 8.Kägi JHR, Schäffer A. Biochemistry of metallothionein. Biochemistry. 1988;27(3):8509–8515. doi: 10.1021/bi00423a001. [DOI] [PubMed] [Google Scholar]
- 9.Thomas M, Klibanov AM. Conjugation to gold nanoparticles enhances polyethylenimine’s transfer of plasmid DNA into mammalian cells. Proc Natl Acad Sci USA. 2003;100(16):9138–9143. doi: 10.1073/pnas.1233634100. [DOI] [PMC free article] [PubMed] [Google Scholar]
- 10.Rosi NL, Giljohann DA, Thaxton CS, Lytton-Jean AK, Han MS, Mirkin CA. Oligonucleotide-modified gold nanoparticles for intracellular gene regulation. Science. 2006;312(5776):1027–1030. doi: 10.1126/science.1125559. [DOI] [PubMed] [Google Scholar]
- 11.Dahan M, Lévi S, Luccardini C, Rostaing P, Riveau B, Triller A. Diffusion dynamics of glycine receptors revealed by single-quantum dot tracking. Science. 2003;302(5644):442–445. doi: 10.1126/science.1088525. [DOI] [PubMed] [Google Scholar]
- 12.Gao X, Yang L, Petros JA, Marshall FF, Simons JW, Nie S. In vivo molecular and cellular imaging with quantum dots. Curr Opin Biotechnol. 2005;16(1):63–72. doi: 10.1016/j.copbio.2004.11.003. [DOI] [PubMed] [Google Scholar]
- 13.Wang X, Yang L, Chen ZG, Shin DM. Application of nanotechnology in cancer therapy and imaging. CA Cancer J Clin. 2008;58(2):97–110. doi: 10.3322/CA.2007.0003. [DOI] [PubMed] [Google Scholar]
- 14.Sharma AB, Sharma SK, Sharma M, Pandey RK, Reddy DS. Structural and optical investigation of semiconductor CdSe/CdS core–shell quantum dot thin films. Spectrochim Acta. 2009;72:285–290. doi: 10.1016/j.saa.2008.09.031. [DOI] [PubMed] [Google Scholar]
- 15.Bruchez M, Jr, Moronne M, Gin P, Weiss S, Alivisatos AP. Semiconductor nanocrystals as fluorescent biological labels. Science. 1998;281(5385):2013–2016. doi: 10.1126/science.281.5385.2013. [DOI] [PubMed] [Google Scholar]
- 16.Chan WC, Nie S. Quantum dot bioconjugates for ultrasensitive nonisotopic detection. Science. 1998;281(5385):2016–2018. doi: 10.1126/science.281.5385.2016. [DOI] [PubMed] [Google Scholar]
- 17.Wu Z, Zhao Y, Qiu F, et al. Synthesis and characterization of water-soluble, stable and highly luminescent itaconic acid/methacrylic acid copolymer-coated CdSe/CdS quantum dots. J Lumin. 2009;129(10):1125–1131. [Google Scholar]
- 18.Qian H, Li L, Ren J. One-step and rapid synthesis of high quality alloyed quantum dots (CdSe–CdS) in aqueous phase by microwave irradiation with controllable temperature. Mater Res Bull. 2005;40:1726–1736. [Google Scholar]
- 19.Smith PR, Holmes JD, Richardson DJ, Russell DA, Sodeau JR. Photophysical and photochemical characterization of bacterial semiconductor cadmium sulfide particles. J Chem Soc Faraday Trans. 1998;94(9):1235–1241. [Google Scholar]
- 20.Sweeney RY, Mao C, Gao X, et al. Bacterial biosynthesis of cadmium sulfide nanocrystals. Chem Biol. 2004;11(11):1553–1559. doi: 10.1016/j.chembiol.2004.08.022. [DOI] [PubMed] [Google Scholar]
- 21.Holmes JD, Smith PR, Evans-Gowing R, Richardson DJ, Russel DA, Sodeau JR. Energy-dispersive X-ray analysis of the extracellular cadmium sulfide crystallites of Klebsiella aerogenes. Arch Microbiol. 1995;163(2):143–147. doi: 10.1007/BF00381789. [DOI] [PubMed] [Google Scholar]
- 22.Lovley DR, Phillips EJP, Gorby YA, Landa ER. Microbial reduction of uranium. Nature. 1991;350:413–416. [Google Scholar]
- 23.Li X, Chen S, Hu W, et al. In situ synthesis of CdS nanoparticles on bacterial cellulose nanofibers. Carbohyd Polym. 2009;76(4):509–512. [Google Scholar]
- 24.Kumar SA, Ansary AA, Ahmad A, Khan MI. Extracellular biosynthesis of CdSe quantum dots by the fungus. Fusarium Oxysporum. J Biomed Nanotechnol. 2007;3(2):190–194. [Google Scholar]
- 25.Narayanan KB, Sakthivel N. Biological synthesis of metal nanoparticles by microbes. Adv Colloid Interface Sci. 2010;156(1–2):1–13. doi: 10.1016/j.cis.2010.02.001. [DOI] [PubMed] [Google Scholar]
- 26.Abdelmelek H. Effects of nanoparticles on electric properties of sciatic nerves at low temperatures and cytotoxicity; The 5th International Symposium on Nanotechnology, Occupational and Environmental Health; August 9–12, 2011; Boston, USA. [Google Scholar]
- 27.Singh V, Chauhan P. Structural and optical characterization of CdS nanoparticles prepared by chemical precipitation method. J Phys Chem Solids. 2009;70(7):1074–1079. [Google Scholar]
- 28.Qi X, Chong X. Surface-defect-states photoluminescence in CdS nanocrystals prepared by one-step aqueous synthesis method. Appl Surf Sci. 2009;255(16):7111–7114. [Google Scholar]
- 29.Yang D, Chen Q, Xu S. Synthesis of CdSe/CdS with a simple non-TOP-based route. J Lumin. 2007;126(2):853–858. [Google Scholar]
- 30.Katari JEB, Colvin VL, Alivisatos AP. X-ray photoelectron spectros-copy of CdSe nanocrystals with applications to studies of the nanocrystal surface. J Phys Chem. 1994;98(15):4109–4117. [Google Scholar]
- 31.Tiwary CS, Kumbhakar P, Mitra AK, Chattopadhyay K. Synthesis of wurtzite-phase ZnS nanocrystal and its optical properties. J Lumin. 2009;129(11):1366–1370. [Google Scholar]
- 32.Cullity BD, Stock SR. Elements of X-ray Diffraction. 3rd ed. New Jersey: Prentice Hall; 2001. [Google Scholar]
- 33.Murray CB, Norris DJ, Bawendi MG. Synthesis and characterization of nearly monodisperse CdE (E = sulfur, selenium, tellurium) semiconductor nanocrystallites. J Am Chem Soc. 1993;115(19):8706–8715. [Google Scholar]
- 34.Hines MA, Guyot-Sionnest P. Synthesis and characterization of strongly luminescing ZnS-capped CdSe nanocrystals. J Phys Chem. 1996;100(2):468–471. [Google Scholar]
- 35.Costa-Fernandez JM, Pereiro R, Sanz-Medel A. The use of luminescent quantum dots for optical sensing. Trends Anal Chem. 2006;25(3):207–218. [Google Scholar]
- 36.Hillyer JF, Albrecht RM. Gastrointestinal persorption and tissue distribution of differently sized colloidal gold nanoparticles. J Pharm Sci. 2001;90(12):1927–1936. doi: 10.1002/jps.1143. [DOI] [PubMed] [Google Scholar]
- 37.De Jong WH, Hagens WI, Krystek P, Burger MC, Sips AJ, Geertsma RE. Particle size-dependent organ distribution of gold nanoparticles after intravenous administration. Biomaterials. 2008;29(12):1912–1919. doi: 10.1016/j.biomaterials.2007.12.037. [DOI] [PubMed] [Google Scholar]
- 38.Nordberg GF, Nordberg M. Different binding forms of cadmium– implications for distribution and toxicity. J UOEH. 1987;9(Suppl 1):153–164. [PubMed] [Google Scholar]
- 39.Klaassen CD, Liu J, Choudhuri S. Metallothionein: an intracellular protein to protect against cadmium toxicity. Annu Rev Pharmacol Toxicol. 1999;39:267–294. doi: 10.1146/annurev.pharmtox.39.1.267. [DOI] [PubMed] [Google Scholar]
- 40.Rodilla V, Miles AT, Jenner W, Hawksworth GM. Exposure of cultured human proximal tubular cells to cadmium, mercury, zinc and bismuth: toxicity and metallothionein induction. Chem Biol Interact. 1998;115(1):71–83. doi: 10.1016/s0009-2797(98)00059-3. [DOI] [PubMed] [Google Scholar]
- 41.Alabi NS, Whanger PD. Influence of dietary selenium on metabolism of cadmium and mercury in reproductive tissues of rats. Anim Reprod Sci. 1987;13(2):143–155. [Google Scholar]
- 42.Seppänen K, Laatikainen R, Salonen JT, et al. Mercury-binding capacity of organic and inorganic selenium in rat blood and liver. Biol Trace Elem Res. 1998;65(3):197–210. doi: 10.1007/BF02789096. [DOI] [PubMed] [Google Scholar]
- 43.Feroci G, Badiello R, Fini A. Interactions between different selenium compounds and zinc, cadmium and mercury. J Trace Elem Med Biol. 2005;18(3):227–234. doi: 10.1016/j.jtemb.2004.09.005. [DOI] [PubMed] [Google Scholar]
- 44.Jorio H, Tran R, Meghrous J, Bourget L, Kamen A. Analysis of baculovirus aggregates using flow cytometry. J Virol Methods. 2006;134(1–2):8–14. doi: 10.1016/j.jviromet.2005.11.009. [DOI] [PubMed] [Google Scholar]
- 45.Vorauer-Uhl K, Wagner A, Borth N, Katinger H. Determination of liposome size distribution by flow cytometry. Cytometry. 2000;39(2):166–171. [PubMed] [Google Scholar]
- 46.Sato K, Obinata K, Sugawara T, Urabe I, Yomo T. Quantification of structural properties of cell-sized individual liposomes by flow cytometry. J Biosci Bioeng. 2006;102(3):171–178. doi: 10.1263/jbb.102.171. [DOI] [PubMed] [Google Scholar]
- 47.Nakamura M, Ishimura K. Rapid size evaluation of nanoparticles using flow cytometry. Adv Sci Lett. 2010;3(2):130–137. [Google Scholar]


