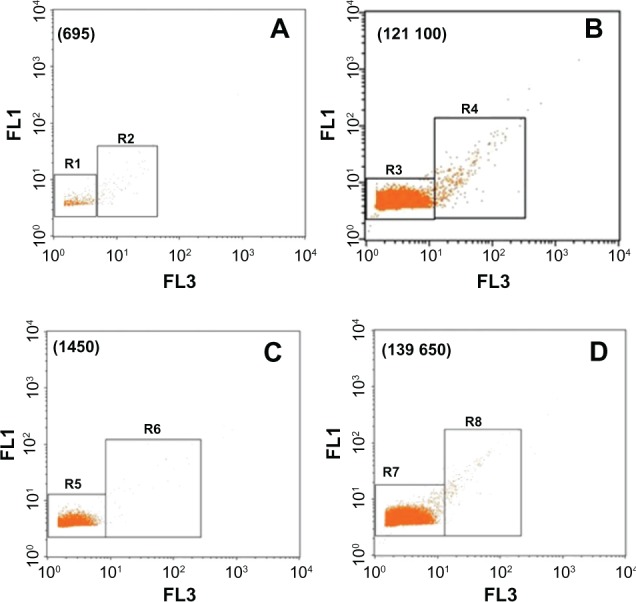
Figure 6.

Dot plots representing the FL1 and FL3 parameters. (A and C) represent the dot plots obtained with control group, in liver and kidneys, respectively; and (B and D) represent the dot plots obtained with Cd-treated group, in liver and kidneys, respectively.
Notes: Events were mostly detected in R3 for liver solution and R7 for kidneys solution. Number of analyzed events is stated within brackets. The results were representative of three independent experiments. Events were acquired for 120 s at constant flow rate.
Abbreviations: FL1, green fluorescence channel; FL3, dark red fluorescence channel; Cd, cadmium; r3, region 3.
