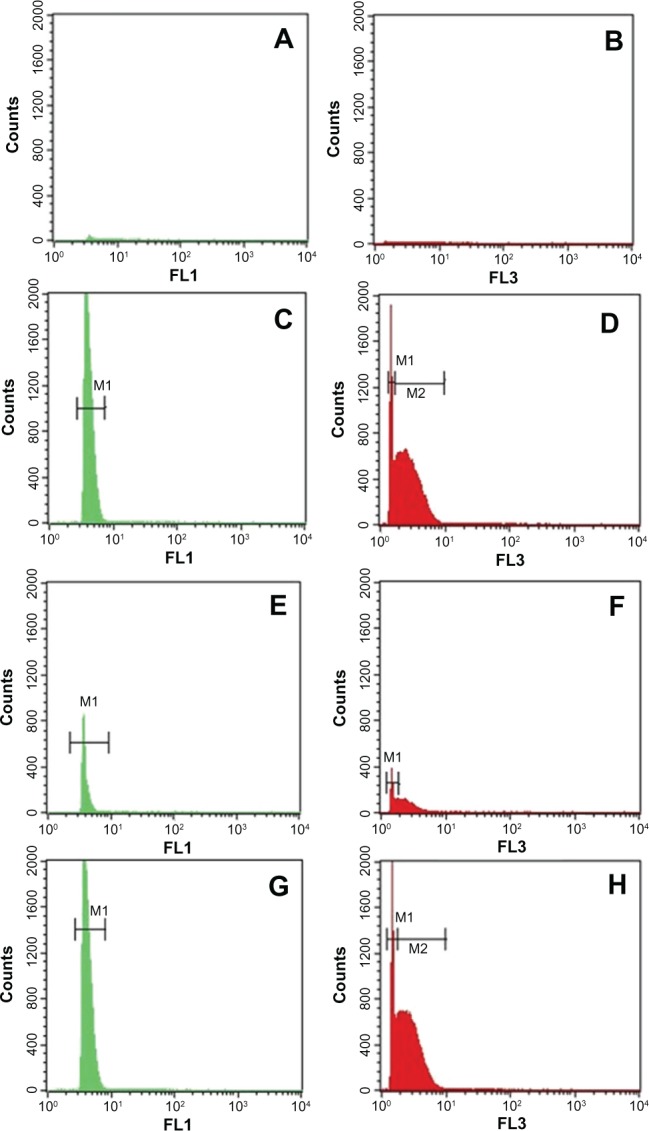
Figure 7.

Dot plots of the analyzed solutions of liver-fraction powder from the control group (A and B) and the Cd-treated group (C and D). Dot plots of the analyzed solutions of kidney-fraction powder from the control group (E and F) and the Cd-treated group (G and H).
Notes: FL1 showed a unimodal distribution with a single peak M1 in liver or kidneys solutions (C and G). However, FL3 revealed a bimodal distribution with two peaks, M1 and M2 (D and H). The results were representative of three independent experiments. Events were acquired for 120 s at constant flow rate.
Abbreviations: Cd, cadmium; FL1, green fluorescence channel; FL3, dark red fluorescence channel; Cd, cadmium; M1, peak M1; M2, peak M2.
