Figure 4.
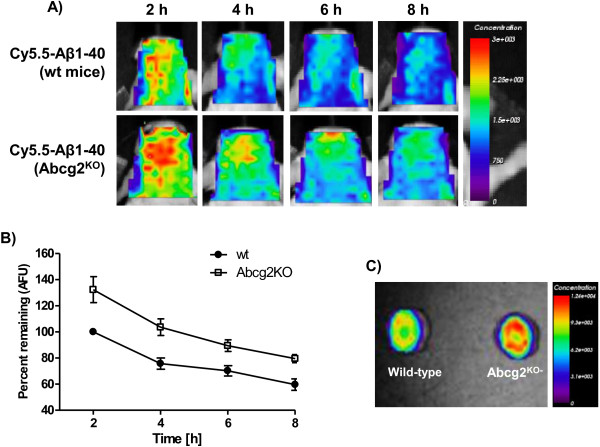
Fluorescence concentration images of the head ROI after i.v. injection of 100-μg Cy5.5-labeled Aβ1-40 peptide into either wild-type or Abcg2-KO mice obtained by eXplore Optix 670. Panel A shows representative serial concentration images of the head ROI at 2, 4, 6, and 8 h after Cy5.5-Aβ1-40 injection. The data are normalized to wild-type animals at 2 h as 100%. Panel B shows time-dependent fluorescence concentration changes (means ± SEM from four paired sets of experiments) in wild-type and Abcg2-KO animals. The data was expressed as percent of fluorescence concentration normalized to 2-h wt animals and analyzed using one-way ANOVA and individual groups were compared Newman-Keuls post-hoc test (for wild-type vs. Abcg2-KO mice: 2 h vs. 2 h p < 0.01, 4 h vs. 4 h p < 0.05, 6 h vs. 6 h p > 0.05, and 8 h vs. 8 h p > 0.05; for Abcg2-KO vs. Abcg2-KO mice: 2 h vs. 4 h p < 0.01, 2 h vs. 6 h p < 0.001, and 2 h vs. 8 h p < 0.001; for wild-type vs. wild-type mice: 2 h vs. 4 h p < 0.05, 2 h vs. 6 h p < 0.05, and 2 h vs. 8 h p < 0.01). Panel C shows ex-vivo brain images from animals sacrificed 8 h after the Cy5.5-Aβ1-40 injection by transcardial perfusion.

