Figure 3.
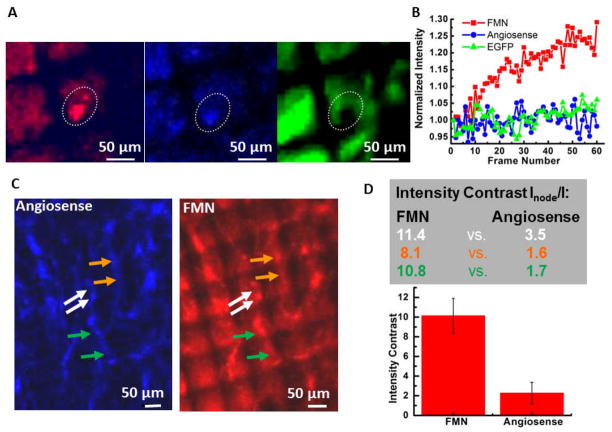
Magnetic targeting of FMN within tumor neovasculature. (A) Real-time observation of magnetic accumulation of FMN to the mesh edge. The three image channels are: red for FMN fluorescence, blue for Angiosense-750 fluorescence, and green for EGFP-transfected tumor signal. Each image represents the first frames of 60 frame movies capturing a 10 min magnetic targeting event starting 4 min after applying the magnetic force. Corresponding movies are shown in the supplementary material. (B) Intensity change with frame number for the ROIs outlined using the white dash in (A). (C) The angiosense™ 750 channel (blue) and the FMN channel (red) imaged 20 min after starting the magnetic field. (D) Top: Intensity contrast for ROIs that circle the nodal spot at the Ni wire edge versus that encloses the vessel area near the center of the Ni mesh hole for FMN (number on the left) and Angiosense (right). The color of the number corresponds to the color of arrows in (C). Bottom: Bar graph presenting the average intensity contrast and standard derivation for the FMN case and the Angiosense case.

