Fig. 1.
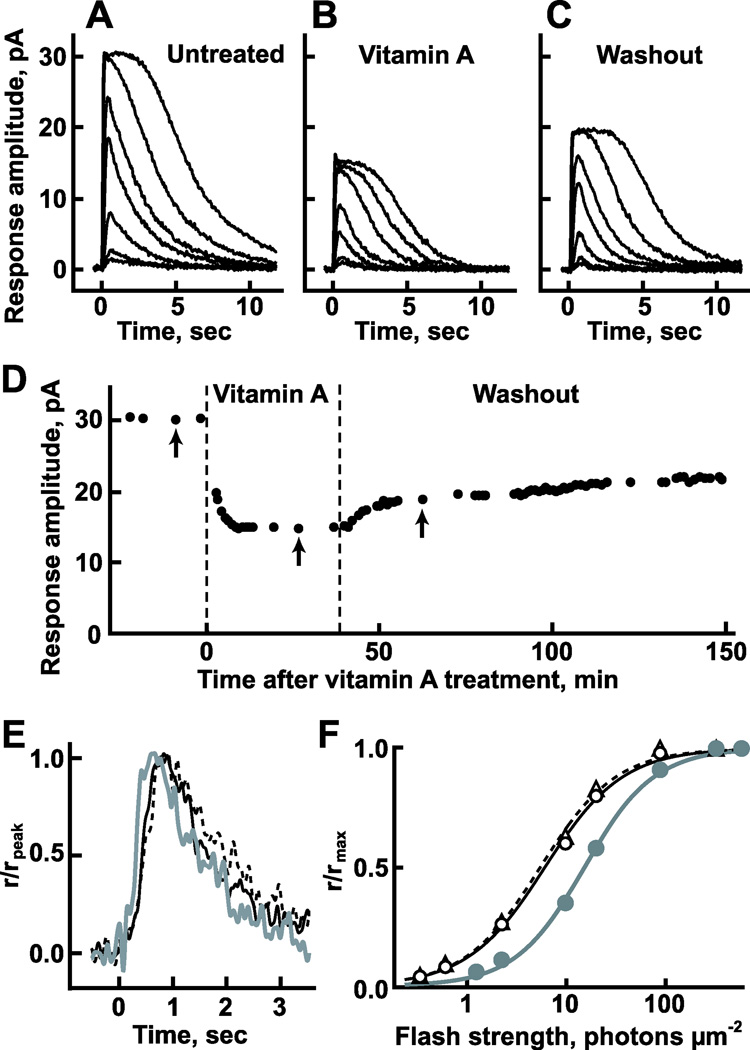
Impact of vitamin A on the flash responses of a representative GS rod. Families of averaged responses to 500 nm flashes before treatment (A), during perfusion with 10 µM vitamin A + 1 µM vitamin E (B), and after washing with Ringer’s containing 6 µM BSA (C). Flashes were given at time = 0 s. Flash strengths were 0.35, 0.63, 2.3, 10, 20, 88, and 320 photons/µm2 for the untreated and washed families and 1.3, 2.3, 10, 20, 88, 320, and 570 photons/µm2 for the treated family. Each trace is an average of 6–11 trials. (D) Time course of the change in maximal response amplitude under the three different conditions. Response families shown in (A–C) were recorded at the times indicated by arrows, respectively. (E) Faster dim flash response kinetics in the presence of vitamin A (gray trace) than before treatment (black trace) or after washing (dashed black trace). Flashes eliciting responses that were <15% of the maximal response under each condition were considered to be dim. Responses were normalized by their peak amplitudes. (F) Loss in sensitivity to flashes induced by vitamin A. The stimulus–response relation during perfusion with vitamin A (gray circles, from B) shifted to the right compared to that before perfusion (open circles, from A). Sensitivity recovered after washing (open triangles, from C). Lines show the fits with eqn. (1): prior to treatment with vitamin A, i0.5 = 6.2 photons/µm2, H = 1.1; during treatment, i0.5 = 15 photons/µm2, H = 1.3; and after washing, i0.5 = 5.6 photons/µm2, H = 1.1.

