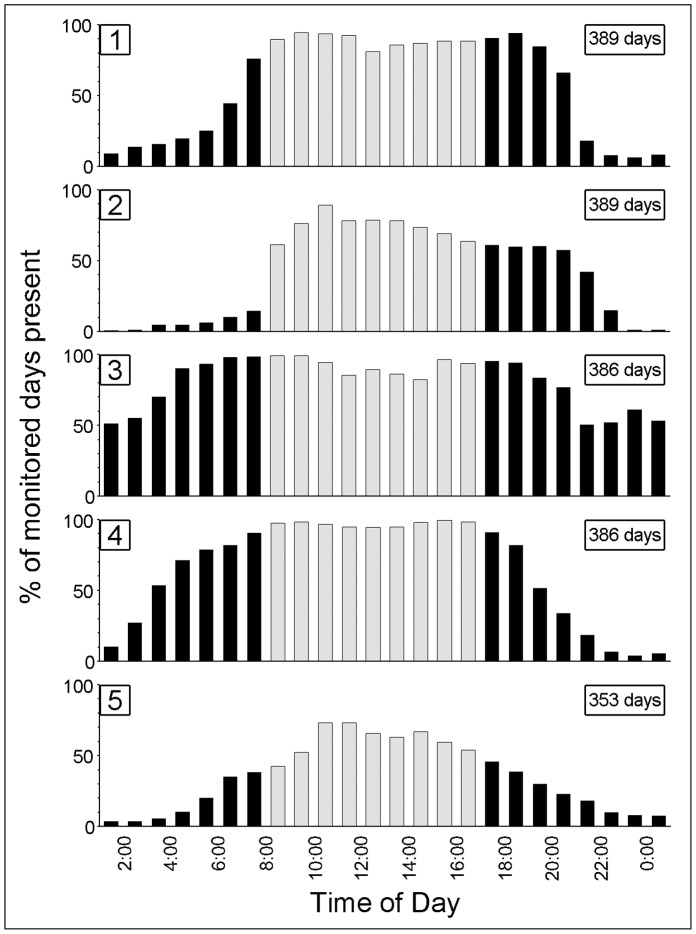
Figure 6. Diel detections of five mature female stingrays on bottom-fixed, automated acoustic receivers at Stingray City Sandbar (SCS).
Percent values (y-axis) represent the number of days an individual stingray was detected on at least one receiver within the hourly time interval shown (x-axis). The values are expressed as a percent of the total monitored days (i.e., one or both receivers were present at SCS). Gray bars indicate typical times of ecotourism provided supplemental feeding.

