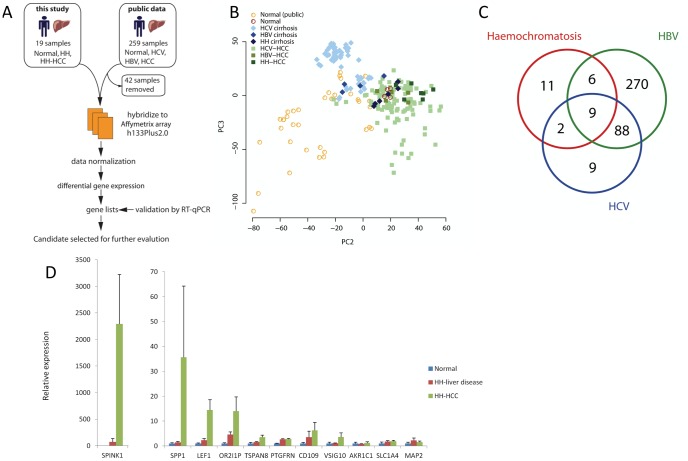
Figure 1. Global gene expression profiles in HCC, liver disease and normal liver reveal both unique and shared components.
Candidate marker SPINK1 is highly up-regulated in HH-HCC. A) Flow diagram illustrating study outline. B) Principal component analysis of global gene expression profiles of normal liver, HCV liver disease, HCV-related HCC, HBV liver disease, HBV-related HCC, HH liver disease and HH-related HCC showing clustering between normal liver, liver disease and HCC samples. C) Venn diagram of differential gene expression, showing number of shared and unique differentially expressed genes between HCV-related HCC, HBV-related HCC and HH-related HCC all compared to normal liver and filtered for >2 fold cut-off. D) Reverse transcribed quantitative PCR for mRNA levels of selected genes identified by microarray analysis in normal liver, HH liver disease and HH-related HCC. Significant p-values for one-way anova: SPINK1 p = 0.0072, SPP1 p = 0.0354, LEF1 p = 0.001, OR2I1P p = 0.031, TSPAN8 p = 0.0181, PTGFRN p = 0.05. CD109, VSIG10, AKR1C1, SLC1A4 and MAP2 p = not significant.

